



A Palladium Bot Earned 58.41%. Breaking Down the Updated Backtest Analytics on Its Example
Backtests used to show profit and a list of deals — the conclusions were up to you. Now the Statistics section includes three new metric blocks. We explain them using the XPD BOT backtest.
[BINANCE] XPD PRO BOT
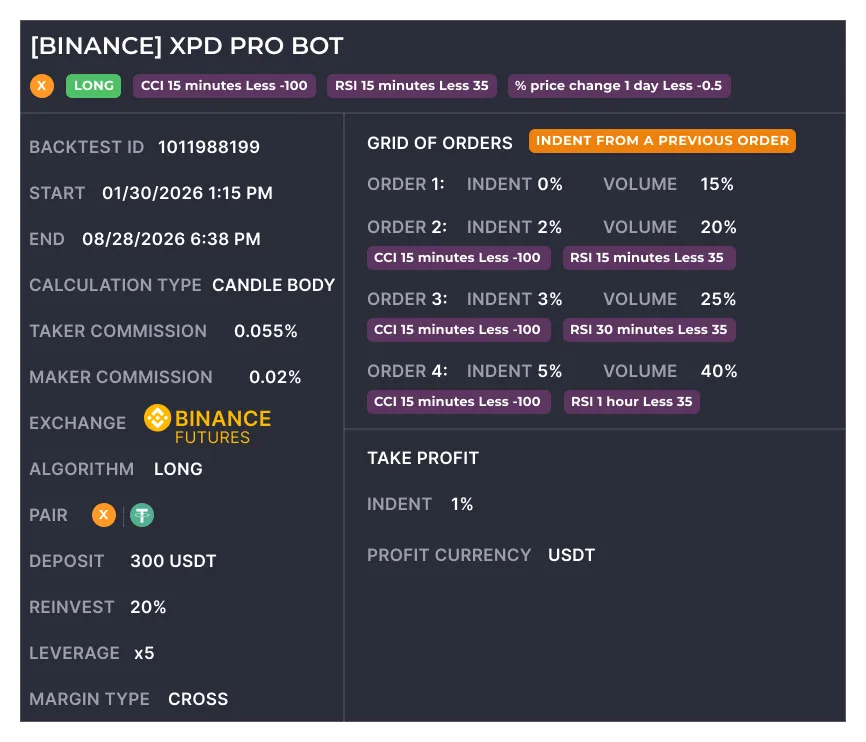
- ROI: +58.41%
- Max drawdown: -142.86 USDT / -9.21%
- Trades in period: 46
- Max time in trade: 13 days
1. The “Good Result” tag — a conclusion calculated for you
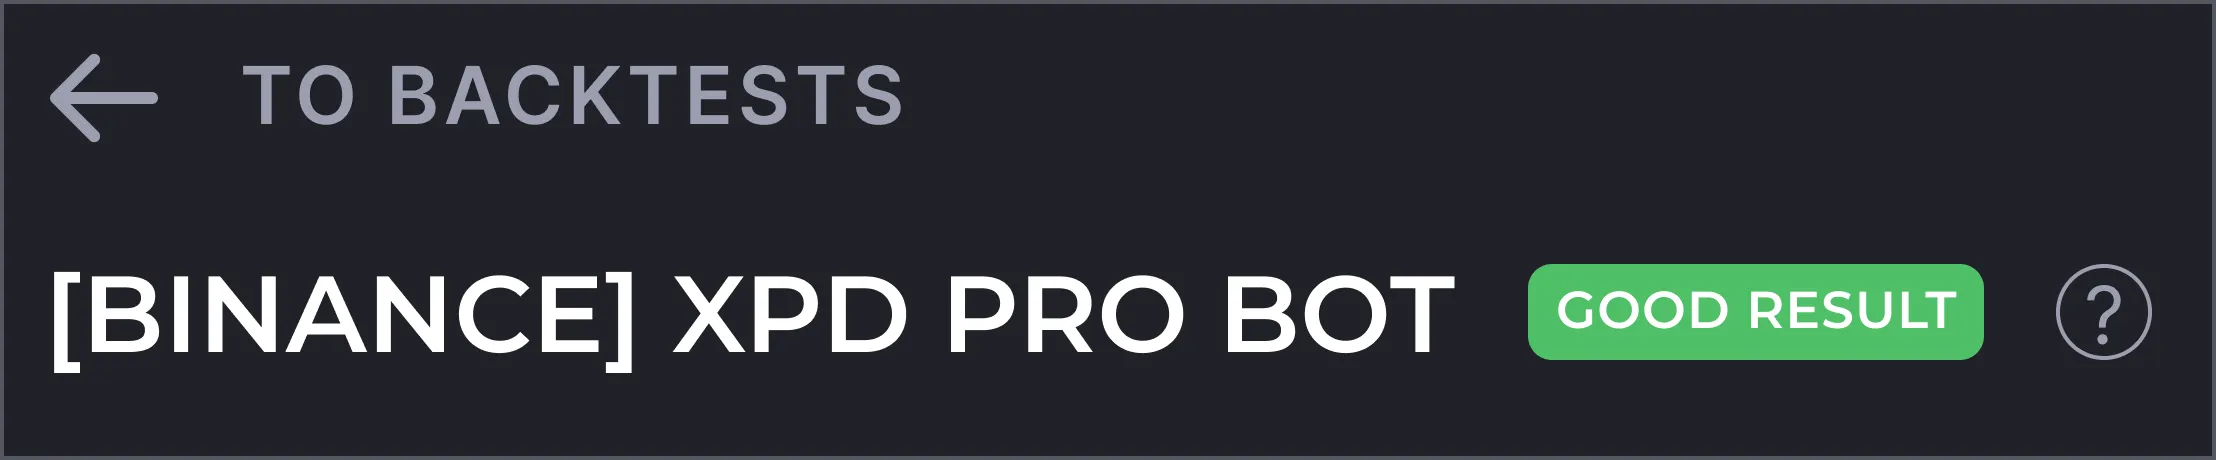
The green tag in the header is assigned based on a formula: Net profit above zero, Recovery Factor above 1, maximum drawdown below 60% of the deposit, at least 30 closed deals, and no open deals at the end of the test. The palladium bot passes all five conditions.
What this gives you: no need to read forty metrics to decide whether a strategy is worth looking at. If the green tag is replaced by “Insufficient Data,” “High Deposit Load,” or “Worse Than Buy & Hold” — address the cause first, then launch (or don’t launch) the strategy.
2. Market comparison — is the bot earning, or is the asset simply rising?
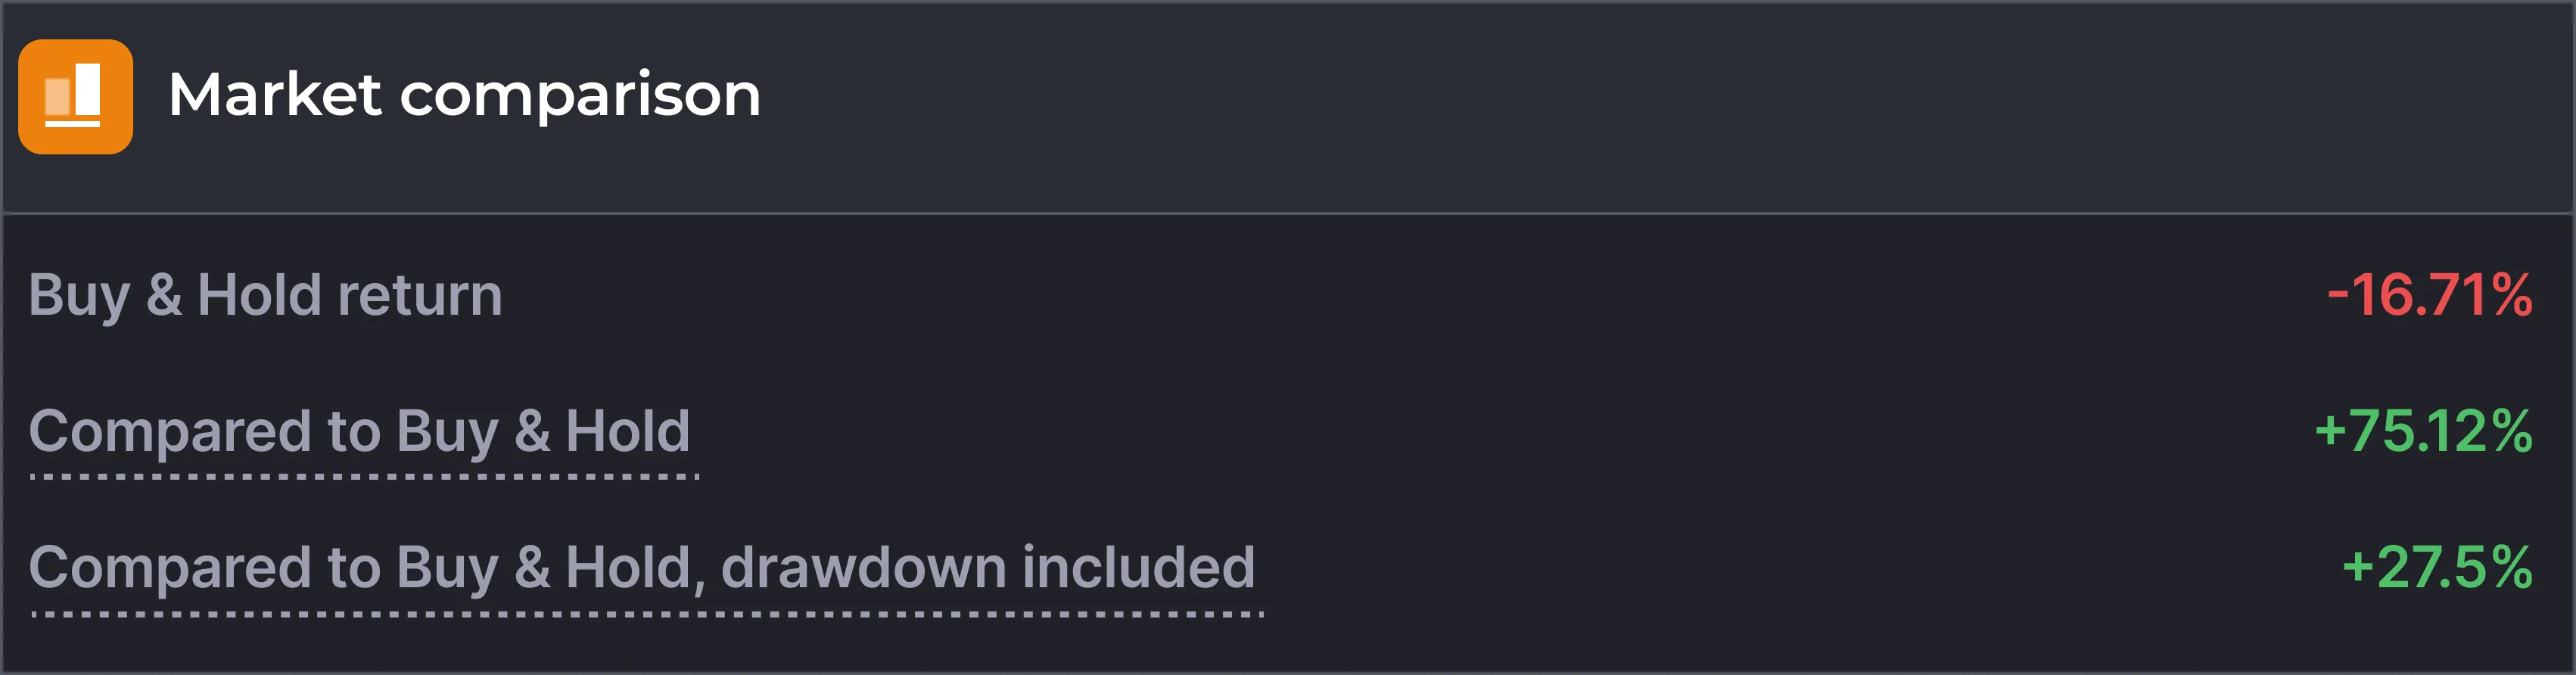
Palladium dropped 17.74% during the test period. Buying the metal for 300 USDT would have resulted in a loss of 53 USDT, while the bot produced a gain of 175.22 USDT. The difference is 228 USDT on the same deposit and the same instrument.
What this gives you: an understanding of where the profit came from. If a bot is up 40% while the asset rose 60% over the same period, the “Buy & Hold Comparison” metric will show a negative — the strategy lagged behind the market.
3. Max drawdown to deposit — the account’s margin of safety
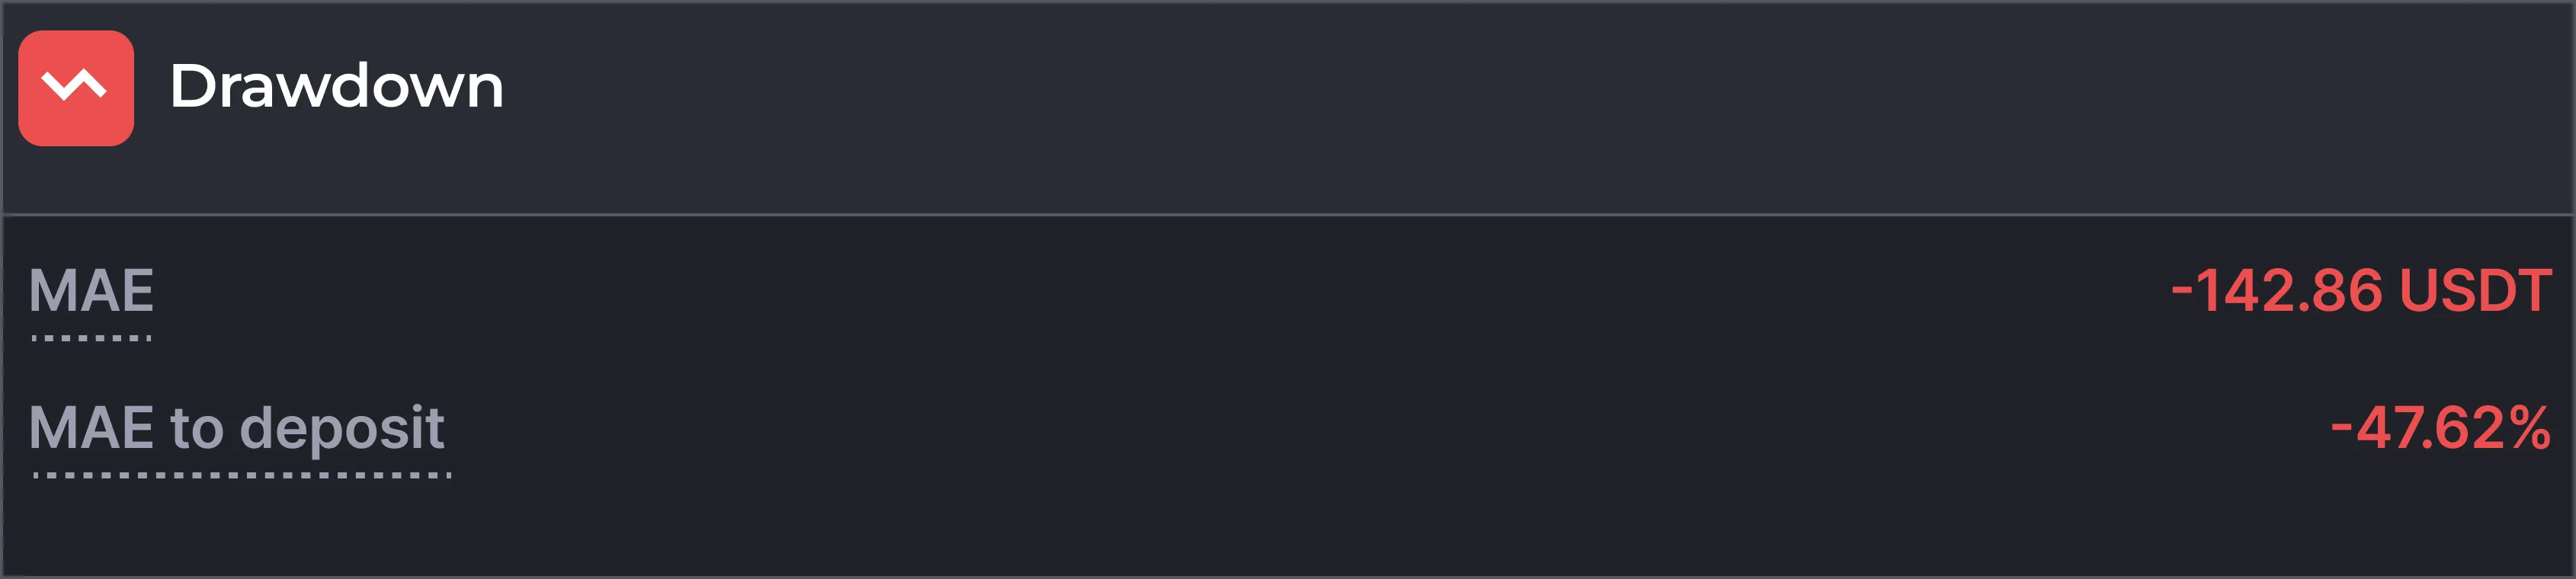
47.62%. The price moved against the position by 9.21% from the average entry price, and at x5 leverage this consumed nearly half the deposit in unrealized loss.
What this gives you: a clear view of how much more the bot could have withstood. Roughly the same move against the position — and the deposit would have run out. The margin here is cross, so a second bot on the same account would share this buffer with the first.
4. Recovery Factor — the ratio of earnings to risk
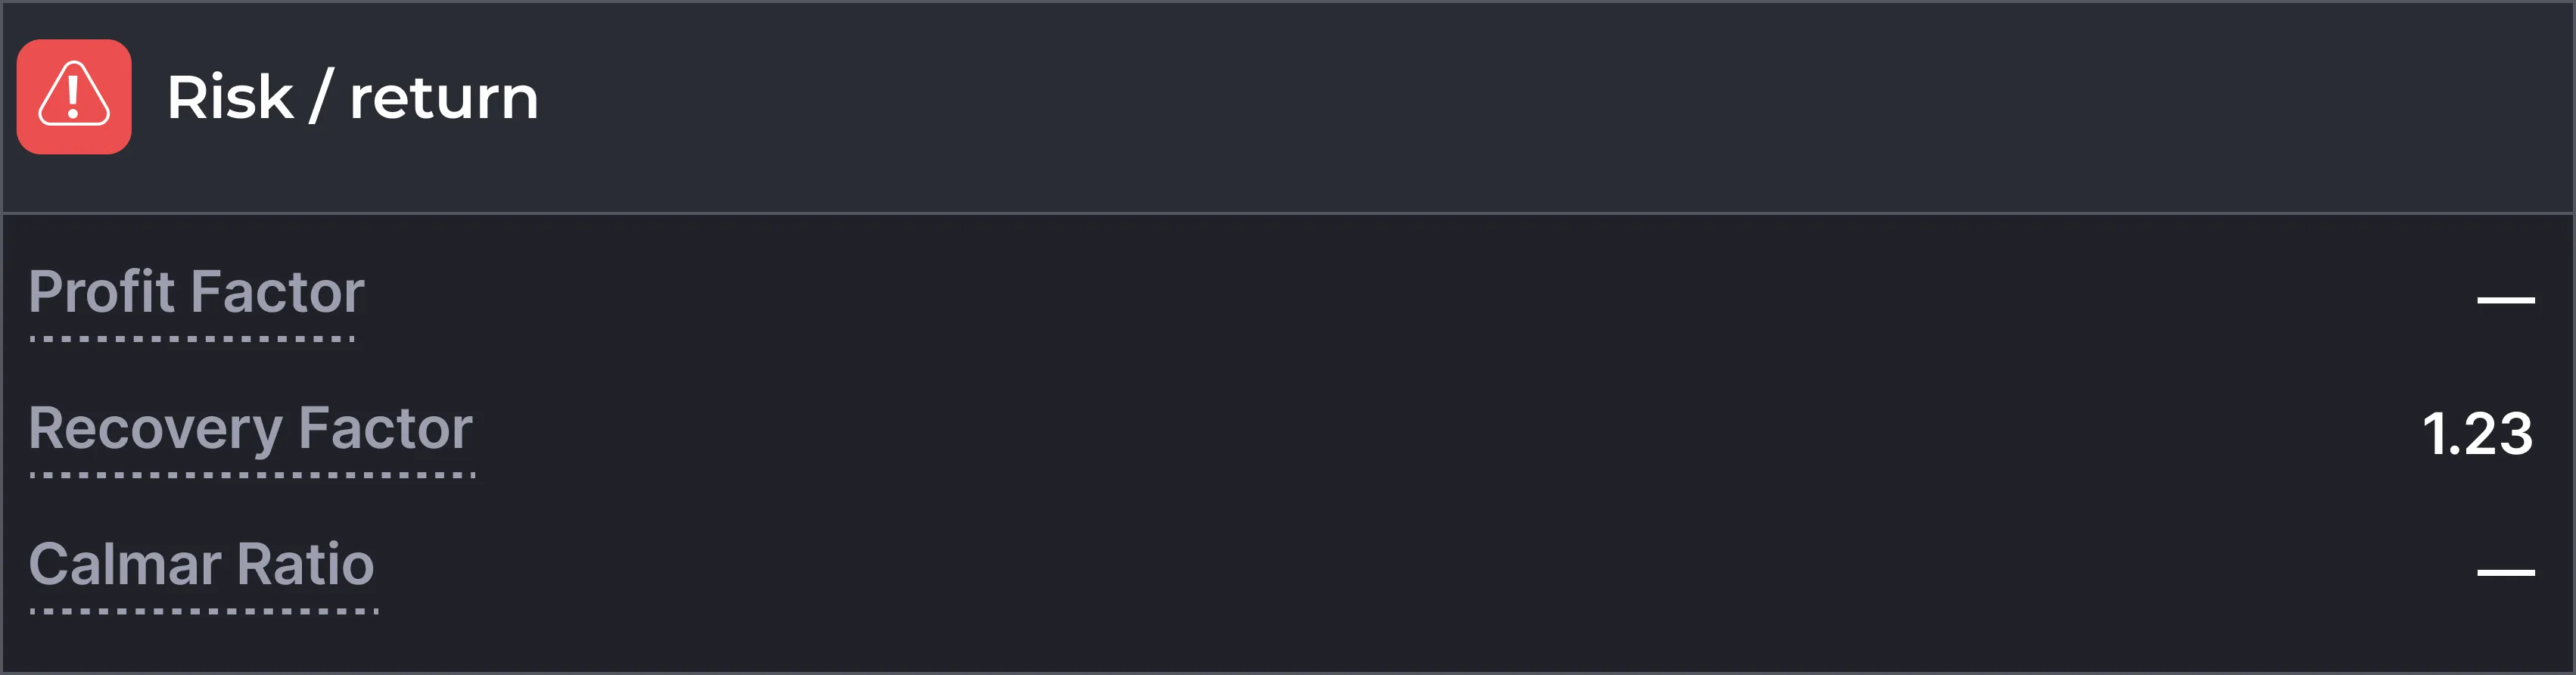
1.23. The bot earned 175 USDT while risking a maximum of 143 USDT.
What this gives you: one number instead of comparing two. Above 1 — profit covered the drawdown. Below 1 — you risked more than you earned, and the tag “Weak Profit-to-Risk Ratio” appears.
5. 100% win rate — a feature of the setup, not algorithmic infallibility
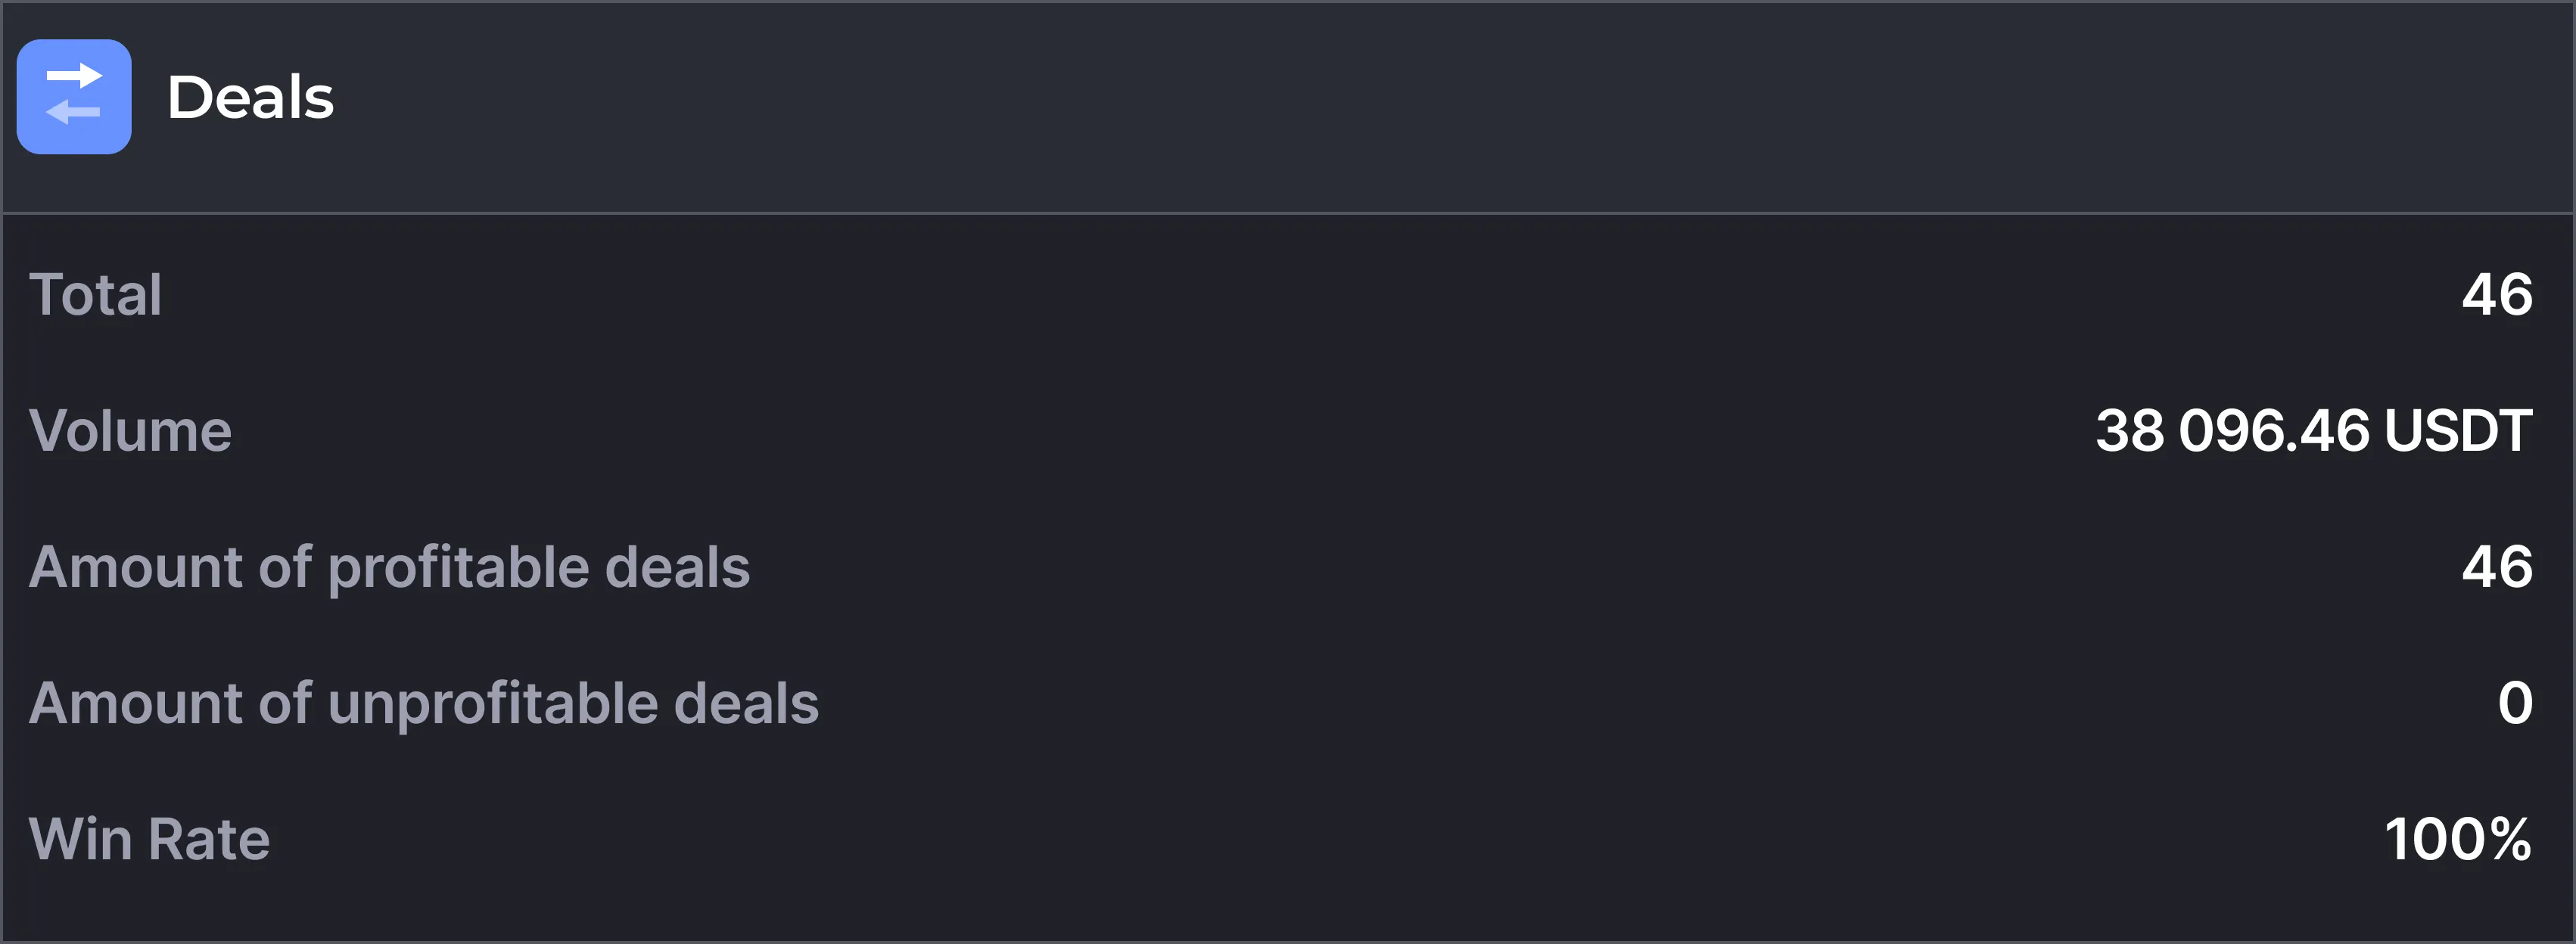
The bot has no stop loss: exits happen only at a 1% take profit, while grid orders are added on drawdowns — each subsequent one placed only with CCI and RSI confirmation. A deal closes exclusively in profit — hence 46 profitable out of 46 and an empty “Stop Losses” row. As long as the price hasn’t returned to profit, the position stays open: the longest deal lasted 13 days 7 hours.
What this gives you: the win rate stops being misleading. Alongside it sit max drawdown, max time in trade, and time in deals (34.17% of the backtest period) — together they show what the strategy’s percentages are actually built on.
6. Net instead of Gross — what would actually remain in the account

The toggle in the header recalculates profit, ROI, Profit Factor, average deal, and all other monetary metrics with and without fees. Net is enabled by default. Here, fees consumed 14.25 USDT — 7.5% of gross profit. Tags are always calculated using Net, even if you switch to Gross view.
—
One bot, four exchanges: profit is nearly identical, drawdown differs
We ran backtests of the same palladium bot on four exchanges. Profit is nearly identical everywhere. But the drawdown on BingX is deeper than the rest by almost a third of the deposit.
| Exchange | ROI | MUL to Deposit | Trades | Time in Market |
|---|---|---|---|---|
| Bitget | +70% | -47.26% | 57 | 31% |
| BingX | +70% | -60.45% | 60 | 42% |
| OKX | +68% | -44.43% | 56 | 31% |
| Binance | +68% | -47.33% | 57 | 29% |
BingX stands out on two key metrics: the deepest drawdown and the most time in market. MUL is especially important as it determines the safety margin a strategy has.
Why results differ
Each exchange has different liquidity and, consequently, different price dynamics. Candles on different exchanges can differ. This means that indicator values at the same moment can show different readings. For the bot, this is the difference between “entry signal present” and “no entry signal.” Our bot opens a trade only when three conditions are met simultaneously:
- RSI on the 15-minute timeframe below 35;
- CCI below −100;
- price change over 1 day below −0.5%.
No trade will occur if even 1 indicator doesn’t meet the specified conditions. Let’s break down a specific example from the backtests shown above.
Example of a specific trade that caused the largest drawdown on BingX
On BingX on May 15, on the 3:30 candle (UTC+3), all three conditions were met, and the bot opened a position that went into deep drawdown.
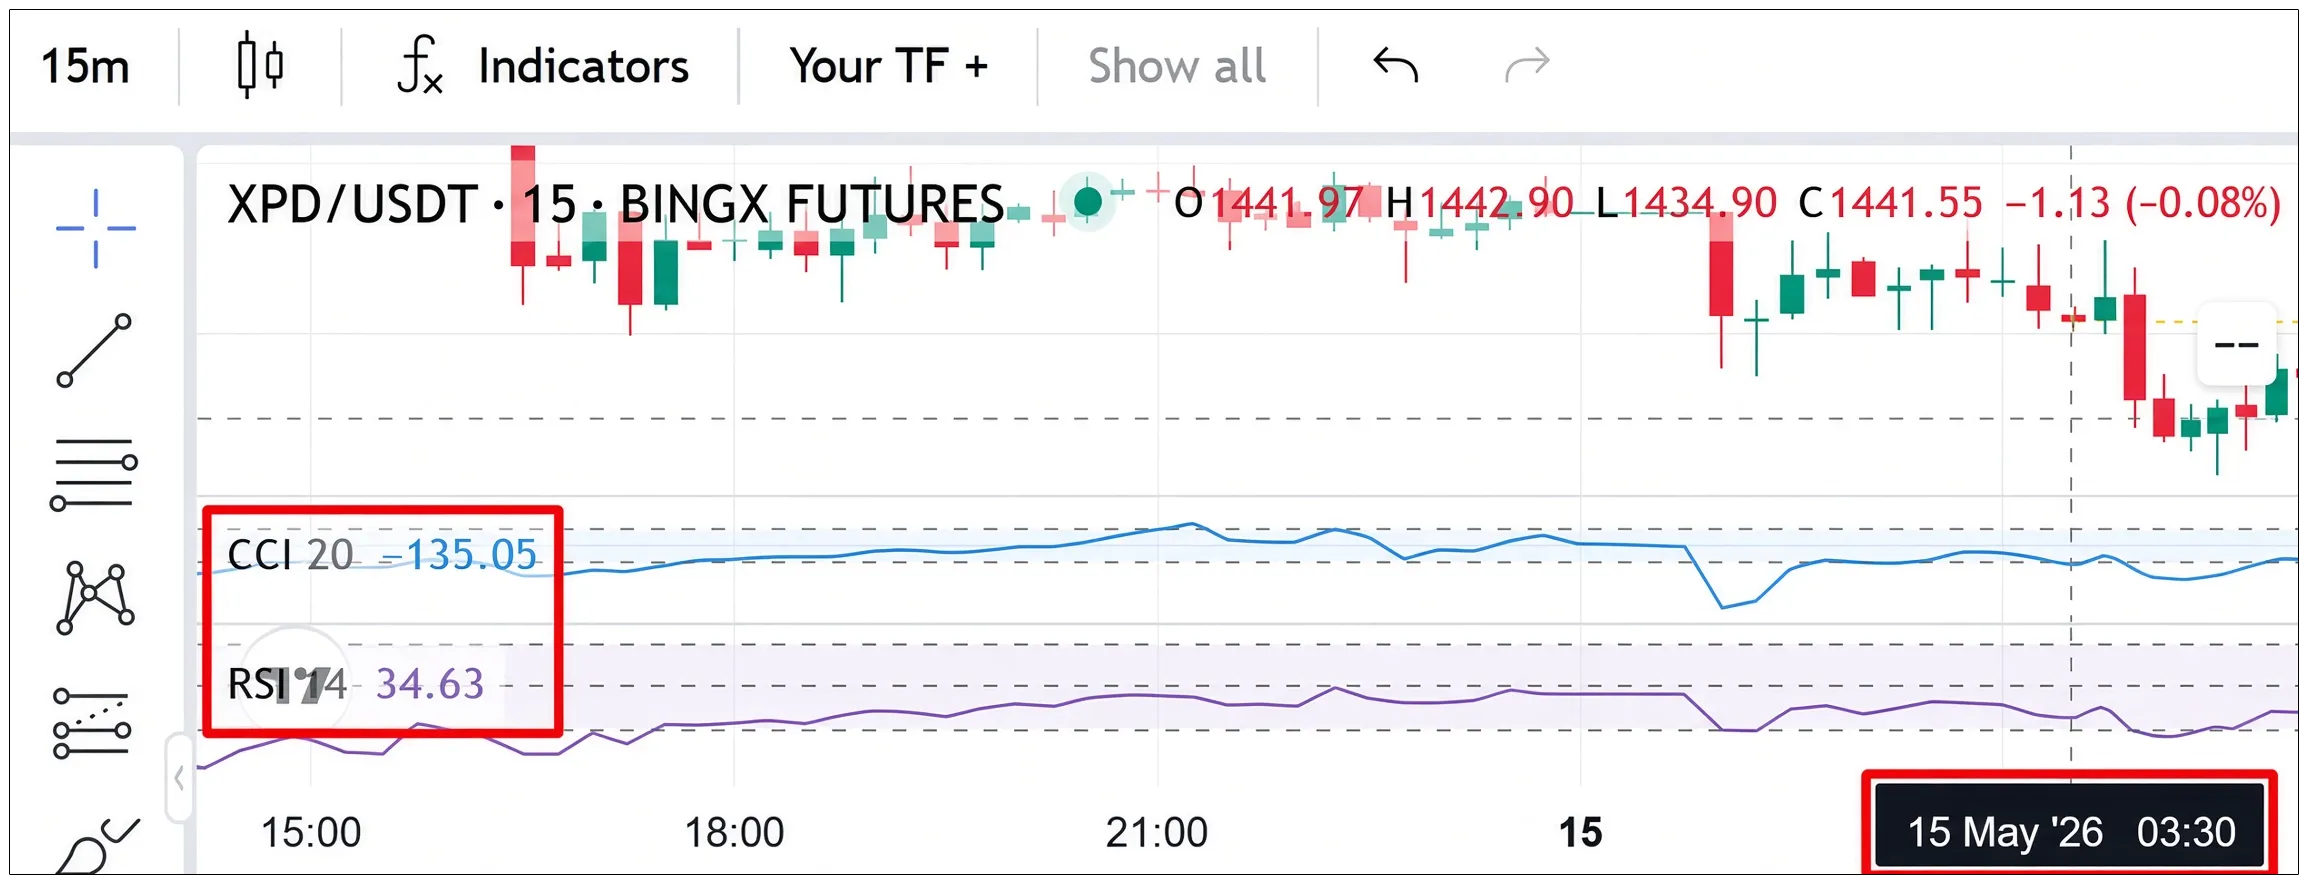
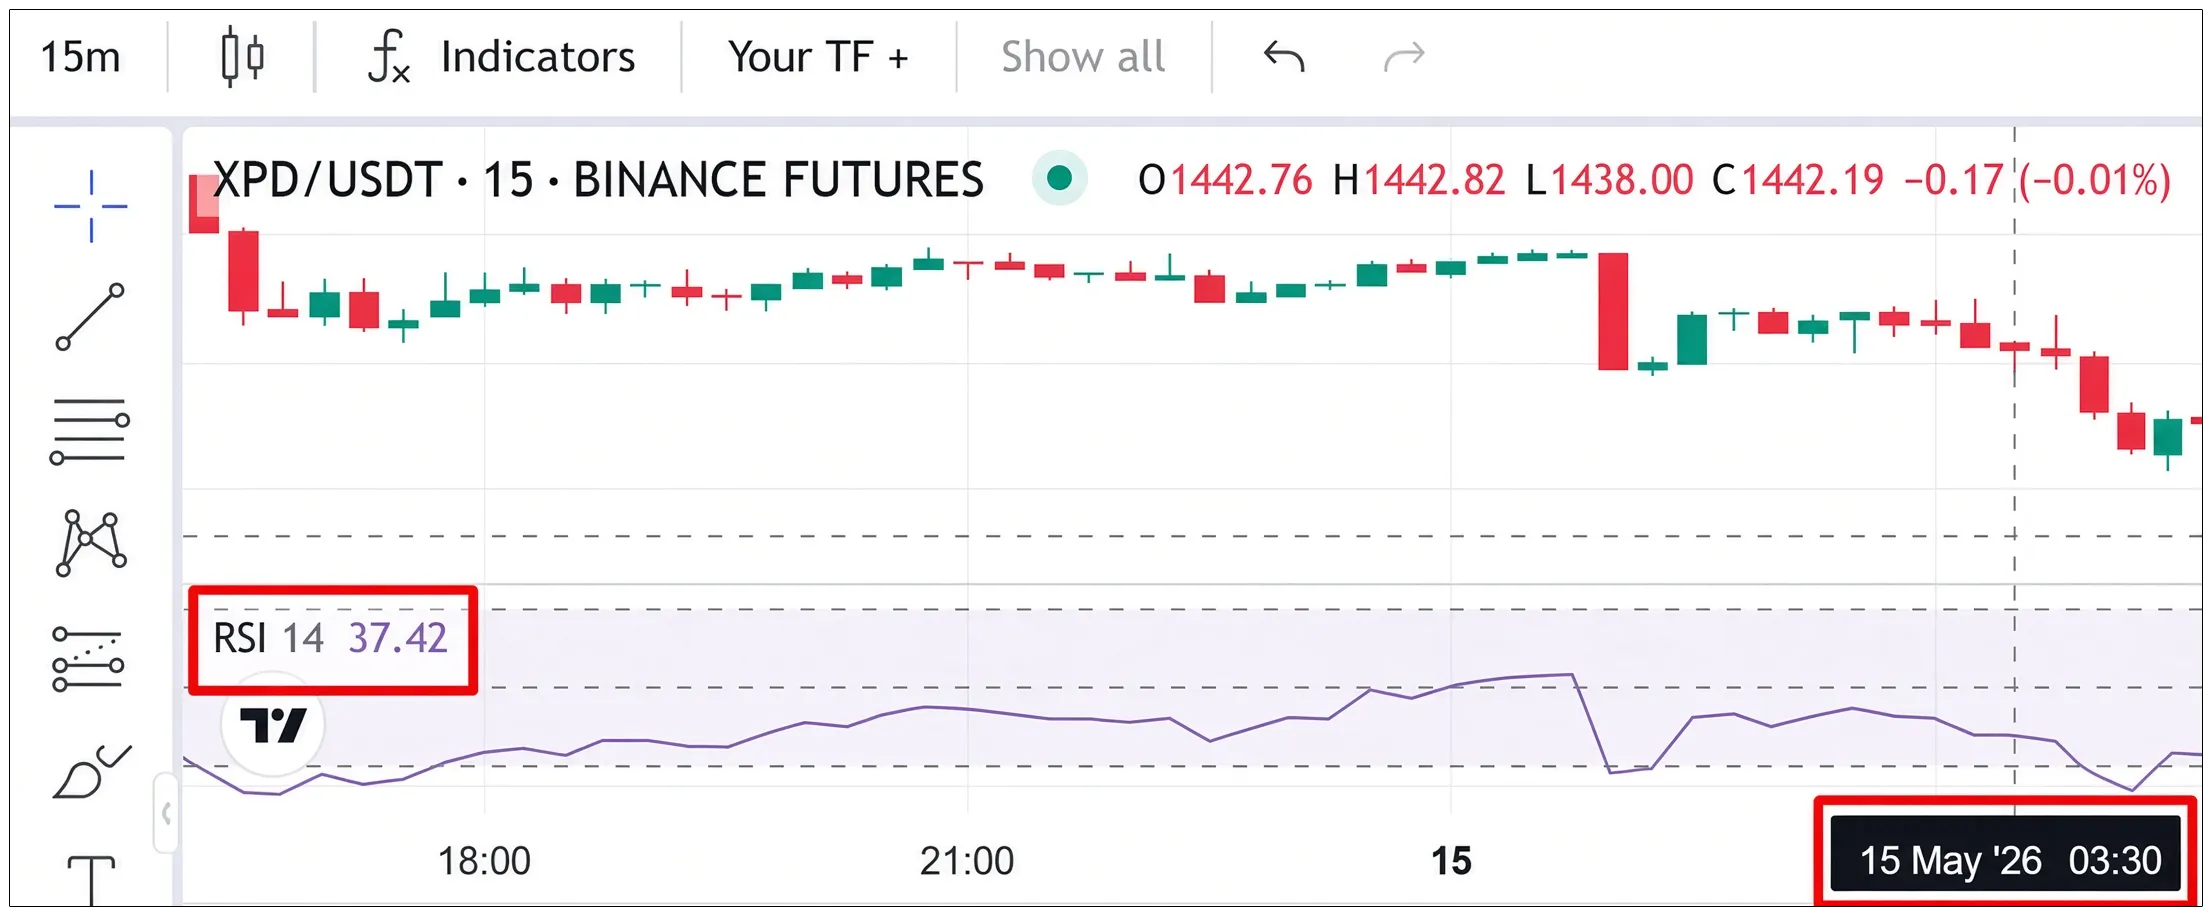
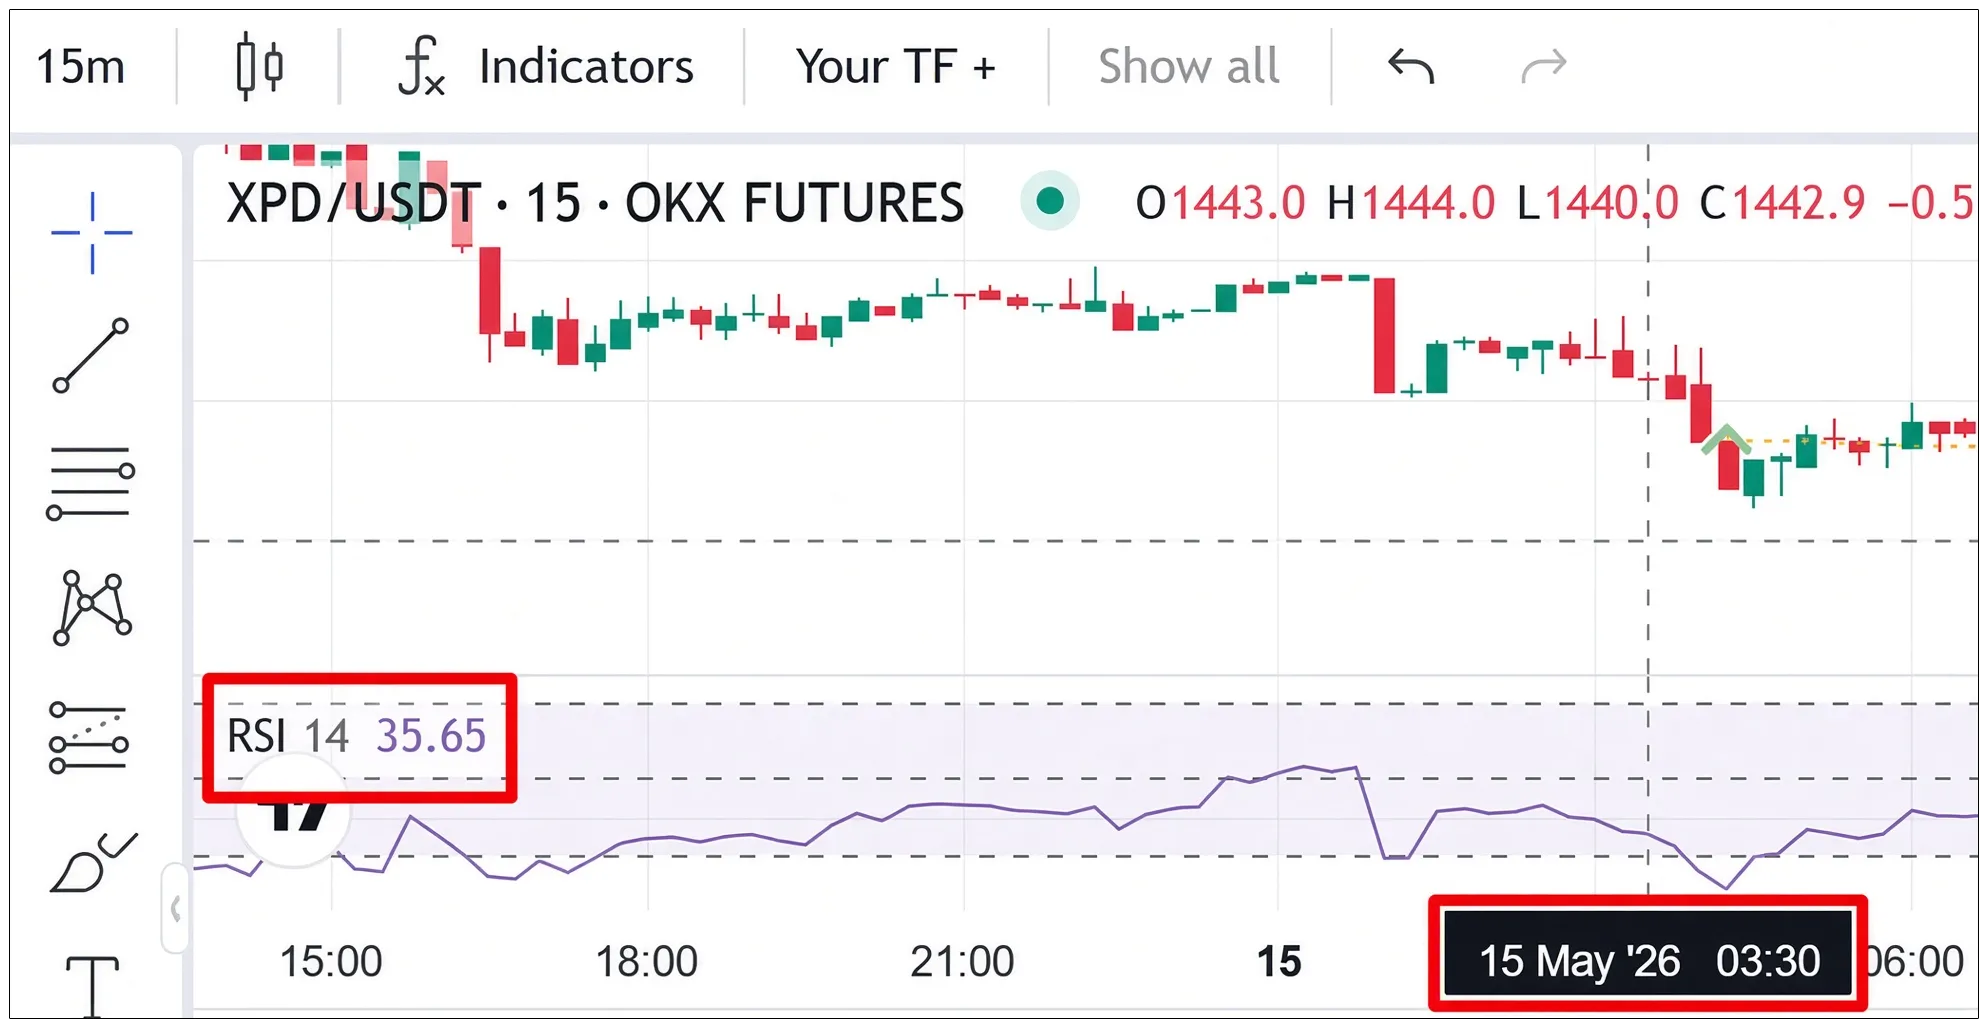
On the other three exchanges, RSI on this same candle did not drop below 35. The condition was not met, which means there was no entry signal.
| Exchange | RSI (15 min) on the 3:30 candle | RSI < 35 condition | Trade entry |
|---|---|---|---|
| BingX | 34.63 | ✅ Met | Yes |
| OKX | 35.65 | ❌ Not met | No |
| Binance | 37.42 | ❌ Not met | No |
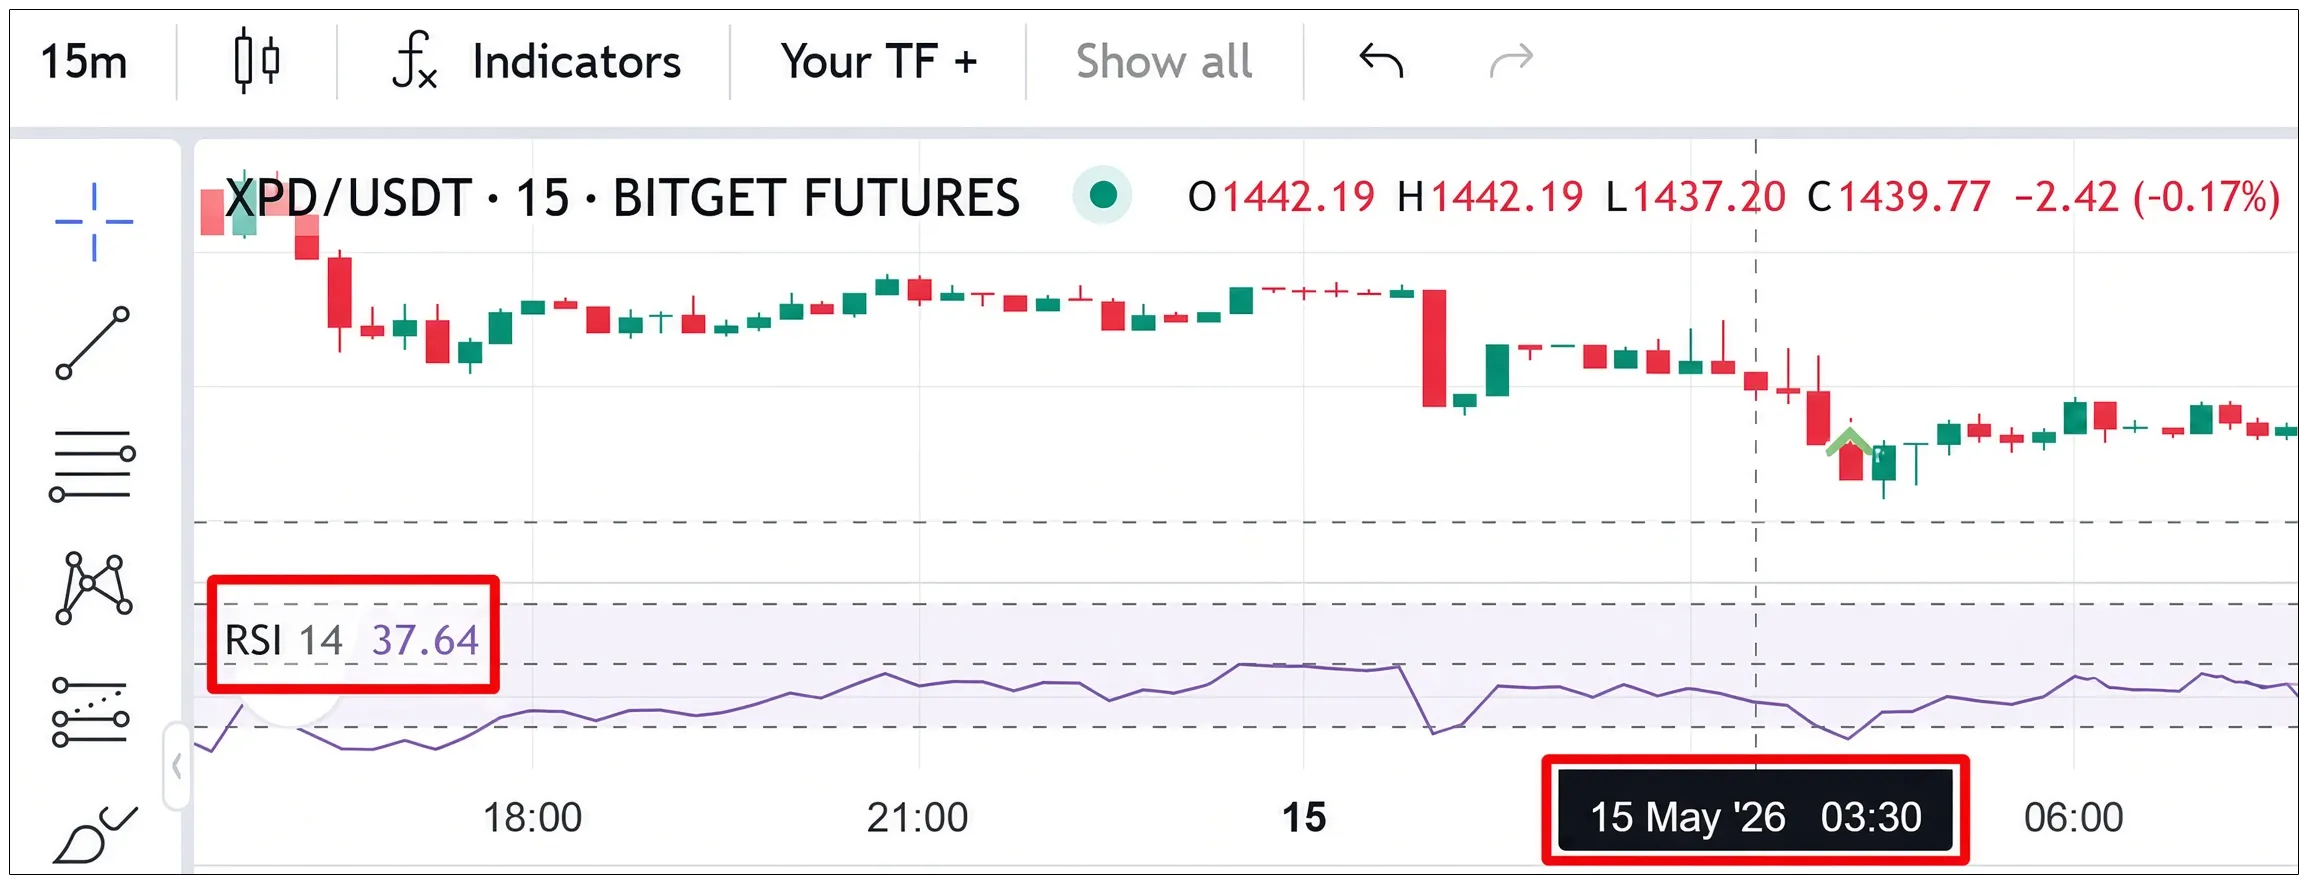
| Bitget | 37.64 | ❌ Not met | No |
Here is how the same candle looked on the exchanges that stayed out of the trade:
Bitget
Binance
OKX
What this means
Always test your strategy on the exchange where you plan to run it. If you need help analyzing backtest results — sign up for a free consultation. Our specialist will answer your questions and help you launch bots.
This material is for informational purposes and is not investment advice. Backtests do not guarantee future results. Cryptocurrency trading involves risk, including loss of capital.