
What are levels in trading
In trading, the concept of a “level” is a fundamental element of technical analysis, allowing you to identify important price marks at which an asset’s price tends to stop, reverse, or break through. Such zones are formed thanks to market psychology—participants remember price areas where there was a strong reaction before and start acting again when the price approaches them. Therefore, all traders need to understand how the support level and the resistance level work, because it is precisely they that form the basis for most strategies.
Why Levels on the Chart Are Needed
Levels on the chart serve as landmarks that help traders find entry and exit points, set targets and stop‑losses, filter false signals, and analyze price behavior during breakouts. Without this visual tool it is impossible to work accurately with trends, ranges, and reversals.
It is also worth knowing the difference between a true and a false breakout of a level so as not to get caught by manipulations and unnecessary losses.
Types of Levels in Crypto
On cryptocurrency charts the following types of levels are encountered:
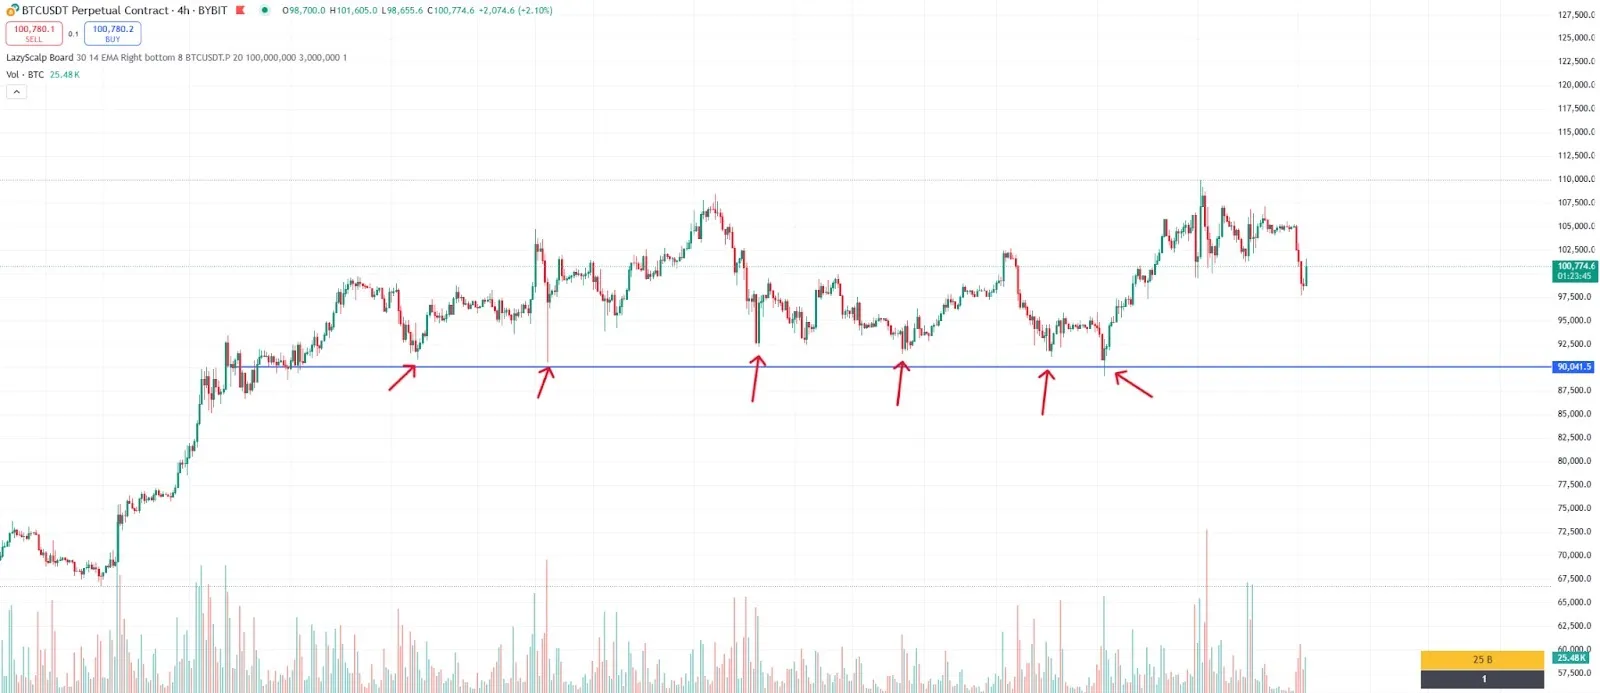
- Support level — an area where the price steadily receives buying strength and bounces upward.
- Resistance level — a boundary where seller pressure does not allow the price to move higher.
- Dynamic levels formed with the help of moving averages and other indicators.
- Fibonacci and levels built by correction zones and extensions.
- Demand and supply zones covering areas where there is a strong imbalance between buyers and sellers.
How to Find Levels on the Chart
To understand how to determine levels, you need to learn to observe the price’s reaction.
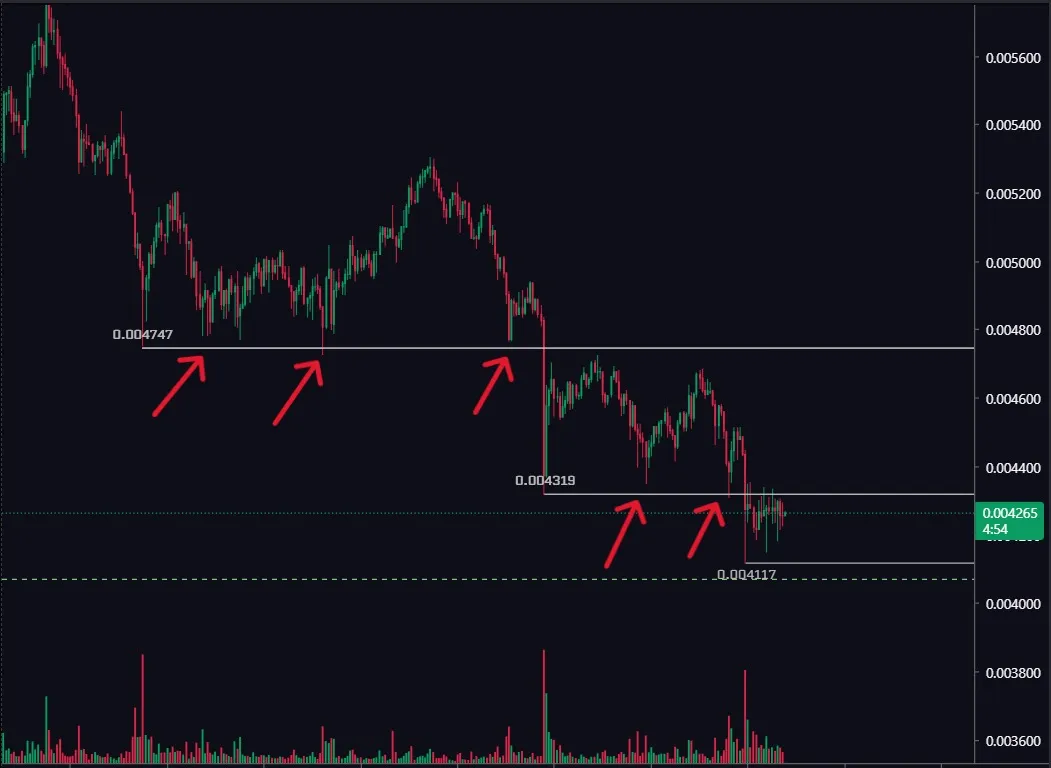
If the chart repeatedly bounced from the same levels, those marks can be considered significant. A competent approach requires confirmation of at least several touches or a reaction at the level in the form of candle wicks. It is also useful to use level indicators and Fibonacci grids, which automatically highlight the strongest zones. Attention is also required to such formations as a false breakout of a level, which often indicates an upcoming movement in the opposite direction.
Trading Strategies on Levels
Trading by levels can be based both on a bounce and on a breakout.
In the first case the trader acts against the current impulse, counting on a reaction.
In the second the trader follows the movement, expecting continuation. Some use a clean chart, others add level indicators for confirmation. However, powerful signals are often born in demand and supply zones, where the greatest volume of interest from market participants accumulates.
Beginner Mistakes When Working with Levels
Many beginner traders overdo it, drawing dozens of lines that have no real significance—commonly called “drawing.” They often confuse levels with random fluctuations or use very small timeframes, which increases the noise around trading and the technical analysis performed. Do not make this mistake, and in case of any questions contact our support or the trader community on Telegram.
Lack of patience is another mistake: opening a trade before confirming a breakout/bounce often—or almost always—leads to losses.
Many also ignore the fact of a false breakout of a level, taking it for a real signal.
An equally common mistake is neglecting Fibonacci and levels when trading, although they can serve as an excellent addition to the main technical or fundamental analysis.
FAQ
-
How to determine levels on a chart without indicators?
You need to observe where the price repeatedly reacted: reversed, slowed down, or bounced.
All these areas will be support and resistance levels. -
Which is stronger: horizontal levels or trendlines?
Both types matter. Horizontal levels are more universal, but trendlines help you work better inside a directional move. -
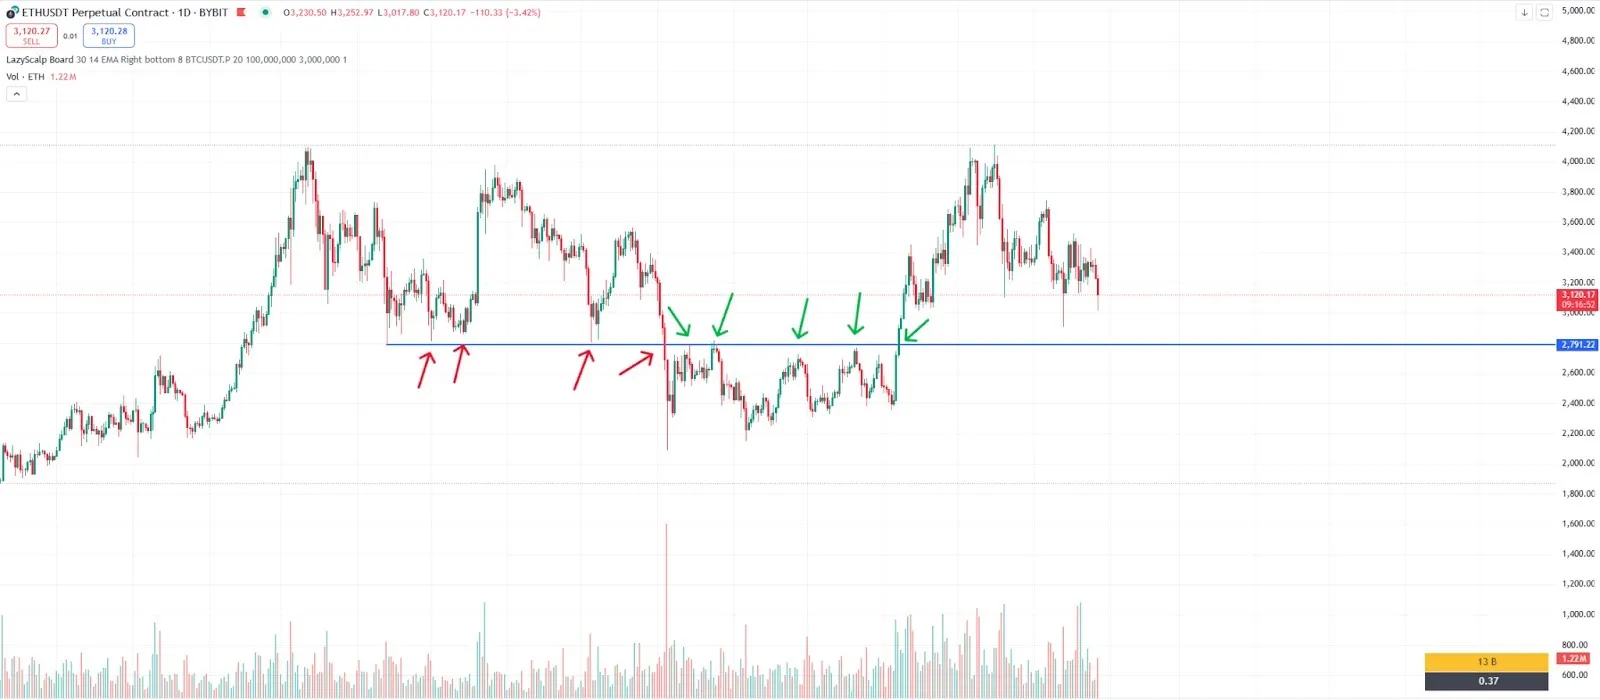
How to recognize a false breakout of a level?
If the price breaks the level but quickly returns back, this signals that the market “shook out” weak hands and is ready to move in the opposite direction. -
Should level indicators be used?
They are not mandatory, but they increase accuracy—especially volume indicators and demand/supply zones. -
Which levels are most effective in cryptocurrency trading?
Fibonacci and levels, volume zones, and visually obvious support and resistance levels often yield the best results.