
Downward wedge in trading
An interesting and frequently occurring pattern of technical analysis is the descending wedge. It can be worked both in a trend and counter-trend, but first of all, it is necessary to understand the technical component, which will be discussed in this part.
What is a descending wedge
A descending wedge in trading is one of the most popular chart patterns, which belongs to the category of reversal patterns. Its peculiarity lies in the fact that with a general decline in prices, each subsequent top and base are lower than the previous ones, but the resistance and support lines converge. Visually, the descending wedge pattern resembles a narrowing triangle directed downward. Despite the downward movement, this pattern often foreshadows a potential upward reversal. This is what distinguishes the wedge from similar patterns, such as the descending triangle pattern, where the expectation of a breakdown is directed downwards.
How the descending wedge is formed
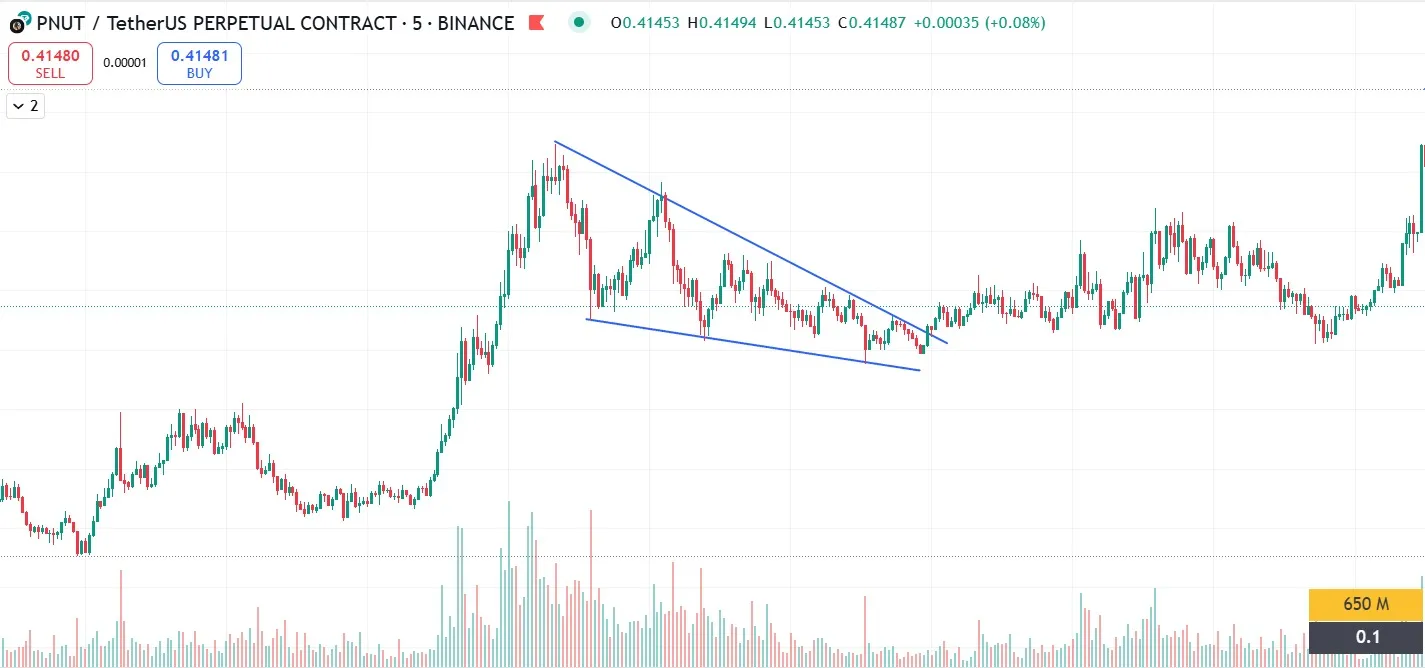
The pattern appears on the chart during periods of slowing decline. Volatility gradually decreases, price movement becomes less aggressive. This behavior is especially noticeable in the consolidation phase after a sharp decline, which can be a sign of a soon change in trend.
How to build a wedge on the chart: it is important to define two lines - the upper line, passing through descending tops, and the lower line, through local lows, also descending, but at a smaller angle. The tapering shape indicates a weakening of selling pressure.
Many instruments in the cryptocurrency market often exhibit this pattern, especially during periods of high uncertainty. In practice, the rising and falling wedge can be part of both short-term and long-term analysis.
What the pattern means for a trader
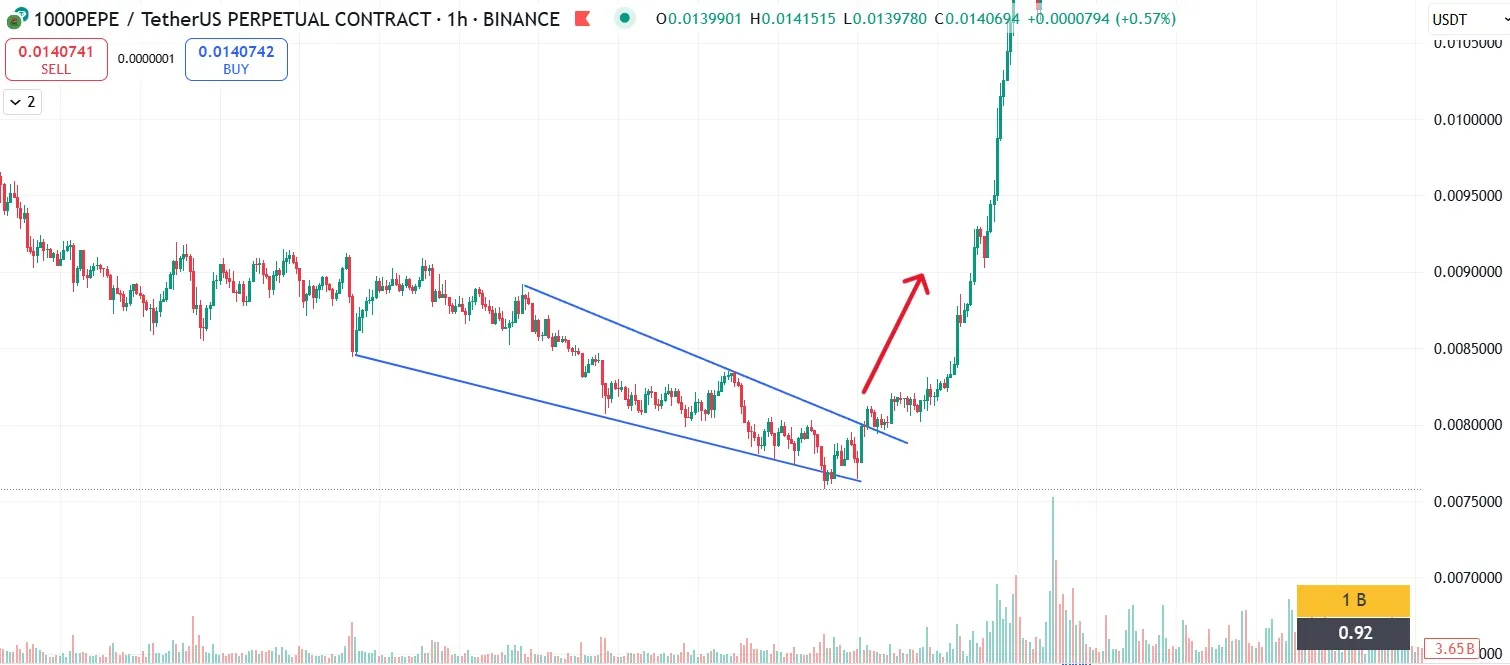
For a trader, a falling wedge can signal the beginning of a new bullish momentum. This is especially true if a descending wedge on an uptrend is formed as a temporary correction. The main signal for action is the breakdown of the descending wedge upward, which is accompanied by the growth of trading volume. The sharper and more powerful the breakout, the higher the probability of confirmation of the trend change.
Understanding what happens after a falling wedge pattern is critical. Usually, a breakdown is followed by a series of candles with high volume and growth, especially in the cryptocurrency market, where movements can be rapid. However, there is a risk of a phenomenon such as a false breakout, where the price briefly goes outside the pattern but then goes back inside.
How to determine the moment of breakout
Determining the moment of breakout requires attention to several factors. First and foremost, you need to watch the price approach to the top of the wedge. The closer the price is to the point of convergence of the lines, the higher the probability of an exit. One of the signs of a real breakout is the growth of trading volume, which strengthens the movement. It is also worth considering the general mood of the market and other figure strategies.
Traders using automated pattern trading should integrate algorithms that can distinguish between a breakout and a false breakout. Systems such as trading bots allow you to automate the process of entering a trade according to set criteria and manage risk.
For those who actively use wedge trading, it is important to keep in mind that each pattern is unique. For example, a rising wedge and a bullish wedge are interpreted differently: the former often portends a fall, the latter a rise.
Examples of trading scenarios
Let’s consider how to trade on the breakdown of a descending wedge in trading. If a descending wedge pattern is formed on the daily chart of a cryptocurrency, and the price approaches the upper boundary with a simultaneous increase in volume, it can be an entry point for longing. A stop loss is placed slightly below the lower boundary of the pattern.
Another scenario: cryptocurrency chart analysis shows the formation of a wedge after a prolonged downtrend. When the price goes up and fixes above the figure - confirmation of the reversal. Using trading bots, you can automate this strategy taking into account the specified entry and exit parameters.
If you use Veles bots for technical analysis, they are able to track chart patterns in real time and notify you of potential signals. This is especially effective when the crypto market is highly volatile, where decisions need to be made quickly.
In general, automated pattern trading gives a significant advantage to those who prefer a systematic approach. A descending wedge is one of the most reliable reversal signals, especially if confirmed by volumes and general market background. In the next part, we will look at how to use the descending wedge in trading strategies.