Flag pattern in trading
There are many graphic patterns in financial markets that help traders predict future price movements. One such pattern in trading is the flag. This pattern often appears on charts and signals a possible continuation of the current trend.
What does the flag pattern look like?
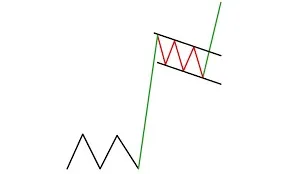
The flag pattern appears on the chart after some strong movement. For example, if the price rises sharply and then begins to decline smoothly in a narrow downward channel, this forms a bullish flag pattern. If the movement was initially downward and then began to move sideways upward, a bearish flag pattern is formed. It is important to understand that a flag pattern in technical analysis is a signal of a continuation of the trend, not a reversal. The market pauses after the impulse and then continues moving in the same direction — this is the main idea of the pattern.
A bull flag pattern in trading often looks like a sloping rectangle pointing downwards. This can be confusing for beginners because the direction of the flag is opposite to the expected movement. However, after exiting the pattern, the price usually continues to rise. The opposite situation occurs with a bearish flag — visually, it points upward but signals a further decline.
The technical pattern of a flag and its role in decision-making
The main role of the flag is to show the trader the moment when the price pauses within the current trend. This is not a reversal pattern. It is a prerequisite that the trend is likely to continue. That is why the flag pattern in technical analysis is considered a continuation pattern.
The flag helps traders determine the entry point. When the price breaks out of the pattern, it often means that a new impulse will begin in the direction of the previous movement, i.e., along the trend. This pattern is a promising signal for decision-making, especially when using trading bots that can automatically open trades on a breakout. The flag is formed as a result of short-term consolidation, where the price corrects slightly after a sharp movement. This allows large players to lock in profits, while the rest prepare for a new breakout. If a trader sees a flag pattern, they can be almost certain that the market is simply pausing to consolidate, rather than reversing.
In such situations, it is important to have clear rules and know how to trade the flag pattern. Only this will help avoid false breakouts and increase the accuracy of entries. In addition, understanding the pattern is also important for analyzing the trading volume of the instrument. At the moment of accumulation, volumes often decrease, and at the moment of a breakout, they increase sharply — this is additional confirmation of the strength of the signal.
Flag pattern on the chart
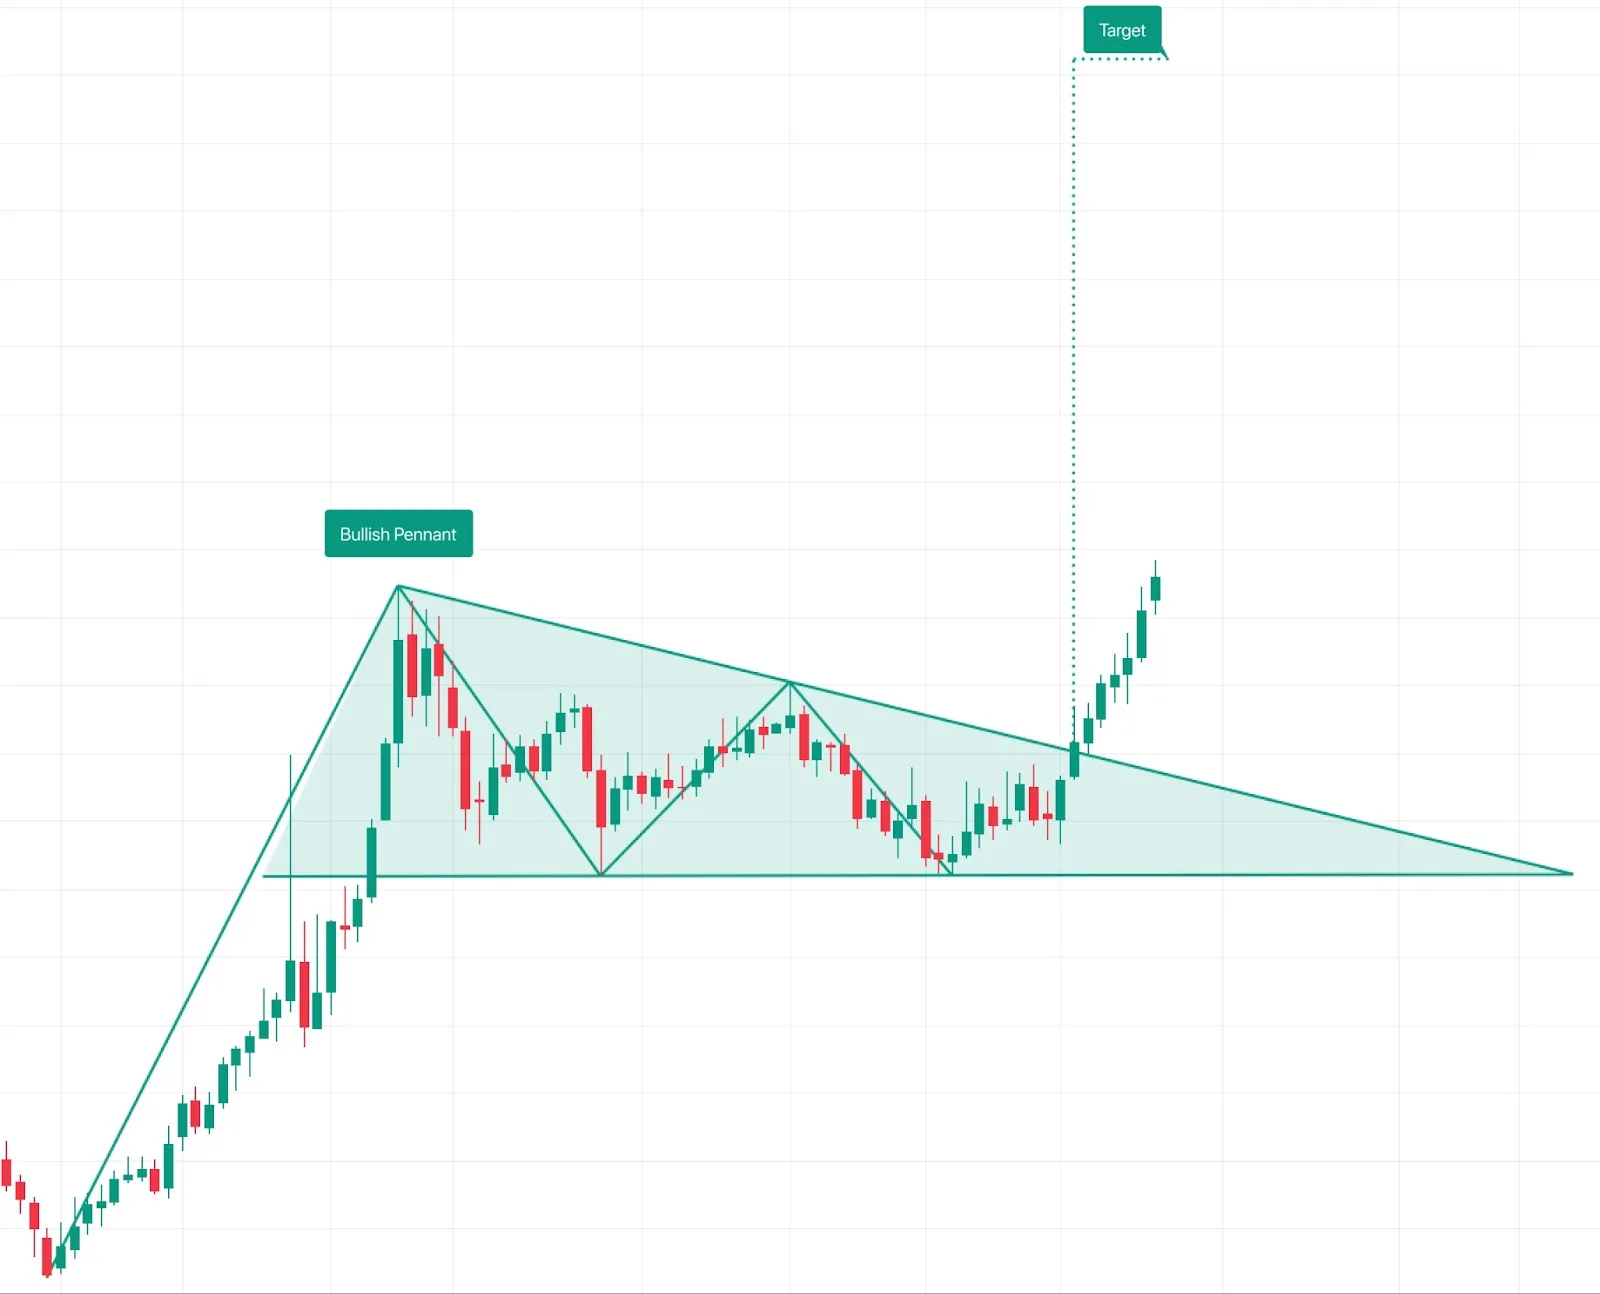
When a trader looks at a chart, they first try to understand where the price will go next. The flag pattern on the chart shows the moment when everything falls into a logical structure. First, there is a strong upward or downward movement — this is the “flagpole” of the flag, showing a strong movement. Then a narrow channel is formed, where the price moves in the opposite direction or sideways — this is the flag itself, i.e., consolidation. Finally, the exit from this channel in the direction of the initial impulse is a signal to act.
It is especially important to be able to see such patterns on different timeframes. A flag in trading can appear on both hourly and daily charts, but the strength of the signal depends on the context. If the flag appears after a long trend, it will be more significant than during a local movement.
The flag pattern in technical analysis
A flag in technical analysis is only part of the overall pattern system on which the entire logic of price behavior is based. It can be classified as a trend continuation pattern, which shows that the market is on pause but will soon continue on its path. It is not just a formation, but the result of the actions of traders who are taking profits, building positions, or waiting for confirmation.
The flag pattern in technical analysis on a chart is important because it works well with other tools. It can be combined with support and resistance levels, volume and volatility indicators, RSI, or MACD. It can be part of both manual and automated strategies. For example, Veles trading bots can work with patterns. They can be set to enter a trade only after a flag breakout and volume confirmation. This reduces risk and makes trading more systematic. If you are unsure of your actions, you can backtest the strategy. This will help you understand how effectively the bullish flag works on historical data. After registering on the platform, you will be able to use backtests and receive a $5 welcome bonus to create and test, for example, your first trading bot.
How to identify a bullish flag
How to identify a bullish flag is an important question and skill for traders, especially in the volatile cryptocurrency market.
To identify a bullish flag, you need to wait until the price breaks through the upper boundary of the channel. This is a signal for the trend to continue. An increase in volume serves as confirmation. If the volume increases during the breakout, this increases the likelihood of a successful entry. This is the moment when the trader makes a decision.
It is worth remembering that the flag analysis pattern does not guarantee results or an accurate forecast of future movements. It is a model of market behavior. It shows probability, but does not provide 100% certainty. Therefore, as always, it is important to use stop-loss, risk management, and other analysis tools.
To better understand what a bullish pattern is and what it looks like, it is worth practicing. Open charts on TradingView, build channels, compare patterns. You will quickly learn to recognize where the flag technical pattern is, and where there is simply chaotic price movement or completely different patterns. It is important to remember that the flag pattern in technical analysis is only part of the system. It works in conjunction with volumes, levels, market context, and many other factors. If you learn to see the bullish flag pattern, understand its structure, apply it, and study its effect with many other strategies, it will give you a significant advantage in the market.
The flag pattern in TradingView
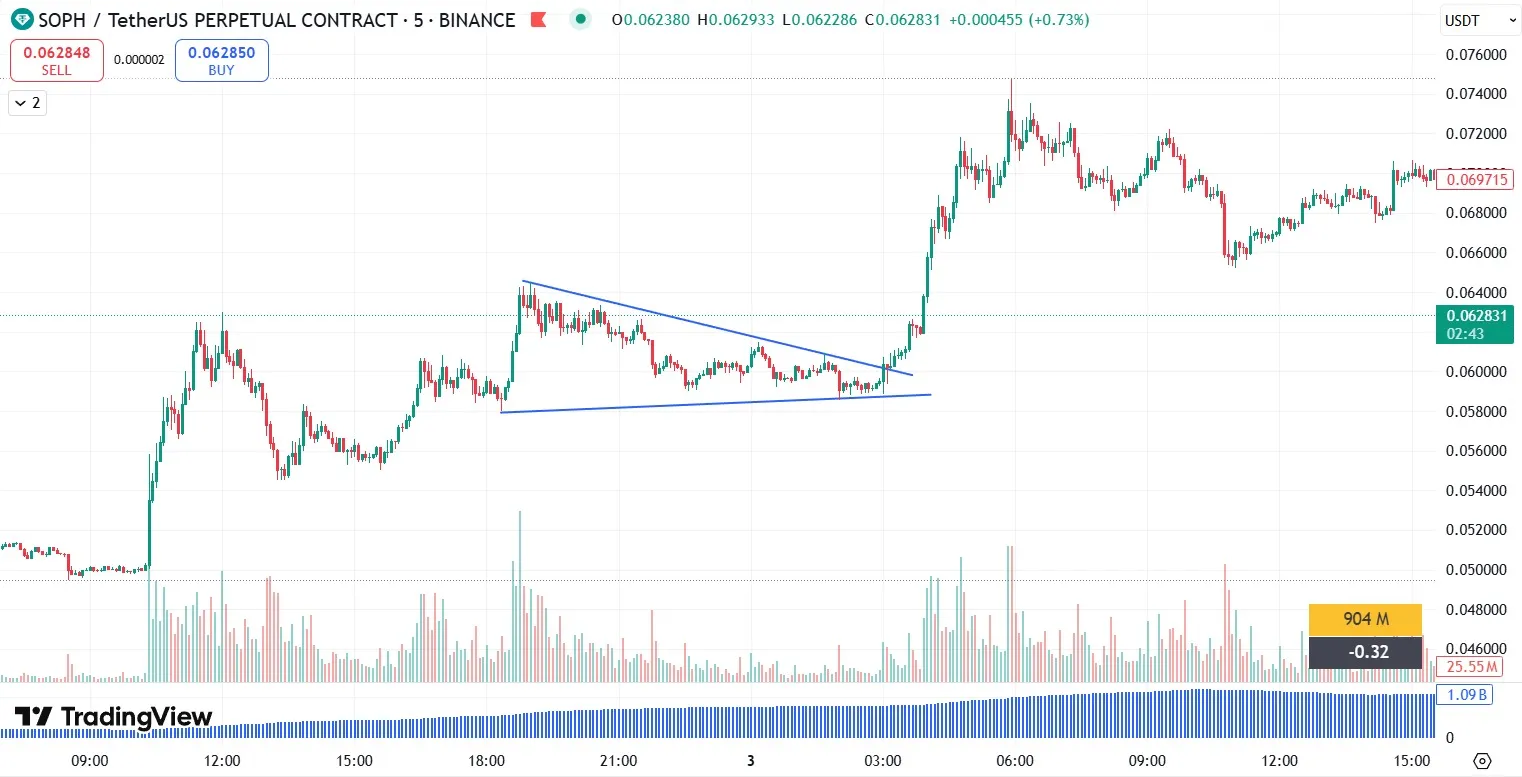
The flag pattern in TradingView is a visual pattern that traders can easily construct using the platform’s graphical analysis tools. It consists of two parts: a strong impulse movement and consolidation in the form of a parallel channel. This structure helps to determine the moment of continuation of the current trend after a short pause.
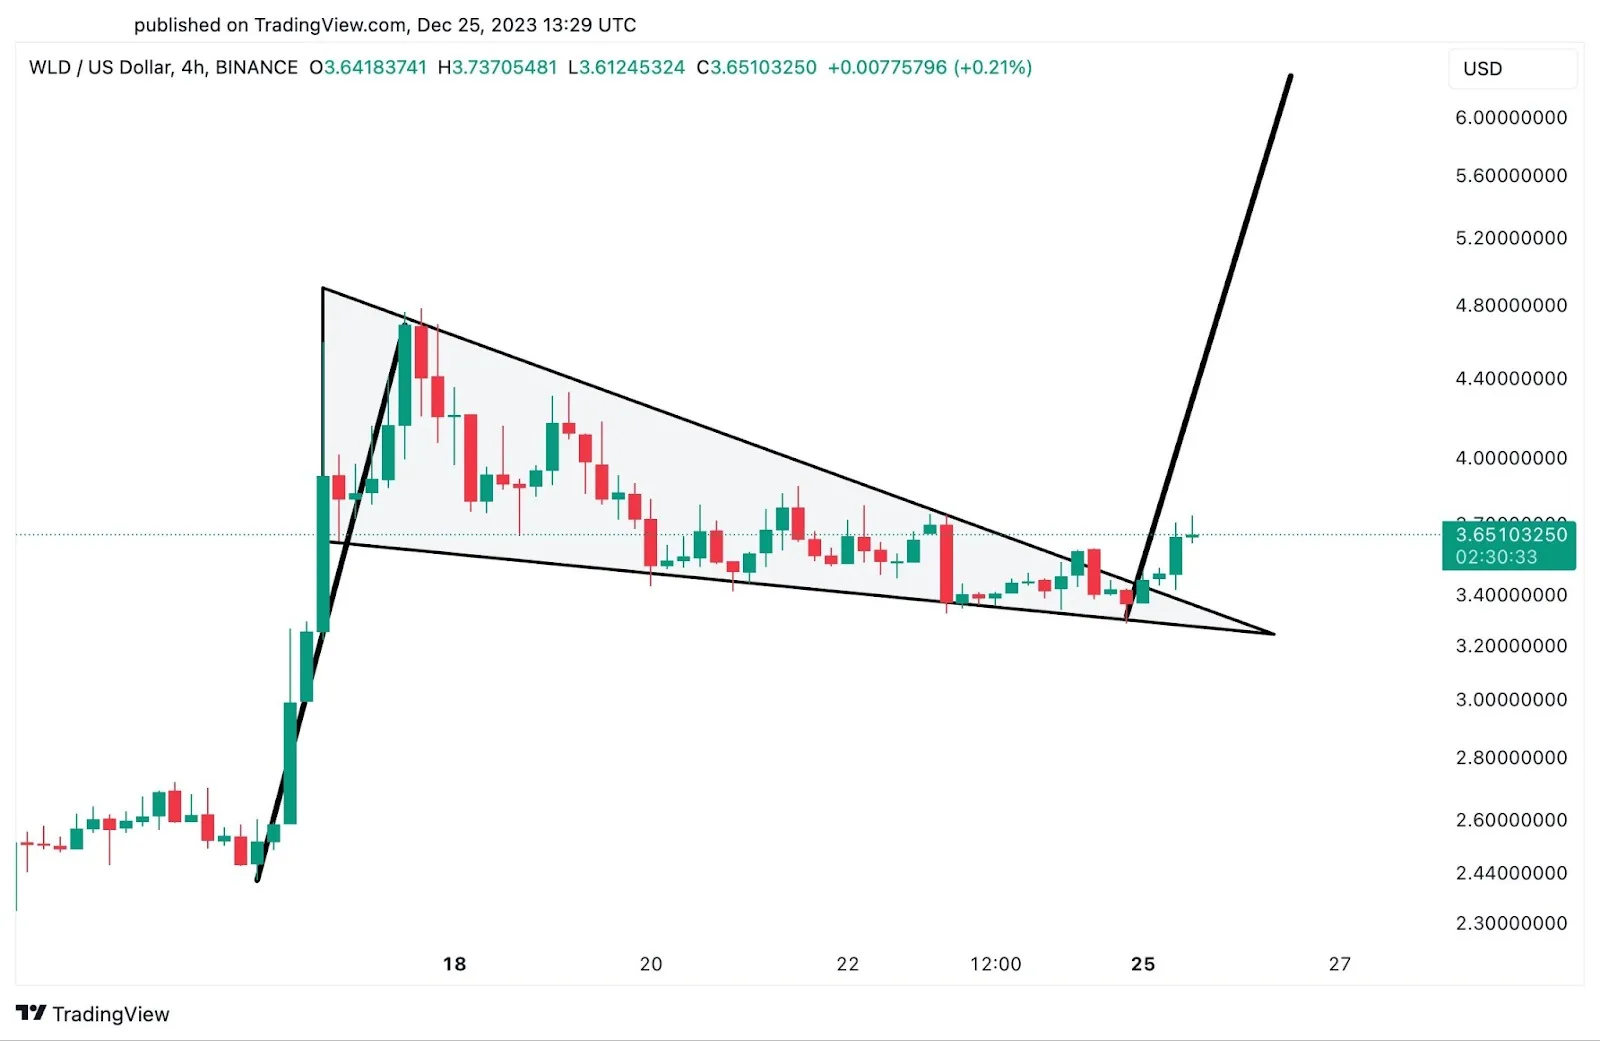
To construct a flag pattern in TradingView, you first need to find a section of the chart with a sharp upward or downward price movement. After that, you need to highlight the area where the price begins to move in a narrowing or horizontal channel. This is the flag. The TradingView interface uses the “Parallel Channel” or “Trend Line” tools to accurately mark the boundaries of the pattern.
The flag pattern in technical analysis on the TradingView chart is especially effective on timeframes of 15 minutes and above. Visually, it appears as a rectangle that is tilted against the main trend. An ascending flag in a downtrend is a bearish flag, and a descending flag after an uptrend is a bullish flag. The TradingView platform allows you to supplement the pattern with indicators, which amplifies the signals. For example, a breakout of the upper boundary of the flag combined with an increase in volume confirms the strength of the momentum. You can also connect signals from trading strategies or scripts written in Pine Script to automate the search for flags.
TradingView makes working with flags and any other patterns as convenient as possible: charts are scalable, templates are available, and you can save markings and use them when developing algorithms or trading bots. This simplifies the analysis process and increases the accuracy of entries.
Patterns in crypto and trading bots
The combination of trading bots and patterns in crypto allows you to trade effectively and without emotion. A pattern is a recurring figure on a chart that suggests price behavior. A trading bot is a tool that can recognize such patterns and automatically open or close trades without your involvement.
Patterns work particularly well in the cryptocurrency market. This is due to high volatility, a large number of retail traders, and the technically oriented nature of crypto trading. Charts often show bullish flags, double bottoms, head and shoulders, triangles, wedges, and diamonds. These patterns in crypto form on any timeframe and give strong signals when broken. Each pattern has its own logic. For example, a flag pattern in technical analysis shows a pause in the trend before it continues. If the bot sees this pattern on the chart, it can place a pending order for a breakout of the resistance or support level. An example is the bearish flag pattern in a downtrend: after the flag is formed, the bot will open a short position when it exits the channel downwards.
Modern trading bots, such as Veles, can do more than just search for patterns. They analyze volumes, confirm signals with indicators, and manage risks. This is important because not every pattern works perfectly. Algorithms allow you to take context into account, rather than relying solely on the shape of the pattern. For example, if a bullish flag pattern in trading coincides with a strong support level and an increase in volume, this is a significant signal. The bot can open a position, set a stop loss beyond the flag’s boundary, and close it at a pre-calculated take profit equal to the height of the flagpole. Using bots in combination with patterns is not just a matter of convenience. It is a systematic approach. It eliminates the human factor, emotions, and hasty decisions. This is especially valuable in the 24/7 cryptocurrency market. Bots do not get tired, do not lose concentration, and can track hundreds of coins at the same time.
Patterns in crypto are the language of the market. Trading bots are tools that translate this language into action. Together, they give traders an advantage and allow them to build strategies with clear rules and risk control.
If you are a beginner and are not sure where to start, it is best to use proven bots with ready-made pattern templates. For example, Veles has a system for automatically recognizing many technical analysis patterns and supports various indicators. This functionality allows you not only to see signals, but also enables bots to act on them — without unnecessary fuss, wasting your time and energy.
FAQ
1. What is a bullish pattern?
It is a graphical model indicating the continuation of an uptrend, for example, a bullish flag pattern in trading.
2. How to distinguish a bullish flag from a bearish one?
A bullish flag is formed after an uptrend, and a bearish flag is formed after a downtrend. The slope of the flag is opposite to the direction of the trend.
3. On which timeframes does the flag pattern work best?
The pattern is most reliable on H4 and D1, but can also be used on smaller timeframes.
4. Does the flag pattern always mean a continuation of the trend?
No, sometimes a false breakout is possible. It is important to wait for confirmation (for example, an increase in volume).
5. Can trading based on the flag pattern be automated?
Yes, with the help of Veles trading bots, which are configured to recognize this pattern.