Hala moving average: concept and use in crypto trading
One of the most popular types of indicators in trading is the moving average. There are many variations of this indicator and one of them is the Hala average, which we will tell you more about.
What is the Hala moving average?
Let’s consider what the Hala average is and its peculiarities.
Hala Moving Average (or Hala Moving Average) is a technical analysis indicator designed to smooth prices more accurately and reduce lag, compared to classical averages. The moving average method is based on double exponential filtering and dynamic weighting. Its task is to react quickly to price changes, while not giving false signals in a sideways market.
Key features:
-
High sensitivity to trend changes.
-
Less lag compared to the SMA line (simple moving average).
-
Suitable for both short-term and medium-term trading.
What is the difference from a simple moving average
Unlike the SMA and EMA indicator (exponential moving average), the Hala moving average or SMA combines the advantages of both methods by eliminating excess noise and reducing lag. While the SMA spreads weights evenly and the EMA emphasizes recent prices, the Hala uses an algorithm that adds a forecasting element to the EMA.
Advantages of using Hala in trading
1. Minimal signal lag
One of the main advantages of the HMA is its high speed of reaction to price changes. It generates signals much earlier than standard moving averages. This allows traders to enter and exit positions in a timely manner, especially in volatile or rapidly changing markets.
Example: The HMA can signal a trend change several candles earlier than the SMA or EMA with the same period.
2. Smoothness without loss of sensitivity
Unlike many fast reacting indicators, the HMA retains a high degree of smoothing. This allows it to filter out small price fluctuations and not react to random market noise. As a result, the trader gets clear signals without unnecessary “jerkiness”.
3. Versatility in application
HMA works well on all timeframes - from minute charts to daily and weekly charts. This makes it useful both for scalpers and intraday traders, and for those who prefer medium- and long-term trading.
4. Clear trend reversal signals
A change in the direction of the Hala line often coincides with the start of a new trend. Especially important is the intersection of the HMA with the price: such moments can indicate a possible entry into a position. At the same time, the bending of the line itself can also signal a reversal or slowdown of the current movement.
5. Easy to customize and integrate into a strategy
Hal’s line can be easily customized for specific market conditions. The period can be changed depending on the timeframe and trading objective. In addition, the HMA combines well with other indicators such as RSI, MACD or volume to build complex but reliable trading systems.
6. Suitable for automated trading
Thanks to its clear formula and highly predictable behavior, HMA is great for creating trading robots and algorithmic strategies. It is easy to program and shows good results in automated mode, especially when the parameters are properly calibrated.
7. performance in different market conditions
HMA performs well in both trending and sideways markets, especially when combined with volume-based or volatility-based filters. This makes it a versatile tool suitable for almost any market scenario.
How to apply the Hala moving average for cryptocurrencies
Indicators for cryptocurrency trading play an important role in decision making. Hala allows traders to:
-
Determine trend direction (up or down).
-
Identify overbought and oversold zones when combined with other indicators.
-
Signal a change of direction when crossing with price or other averages.
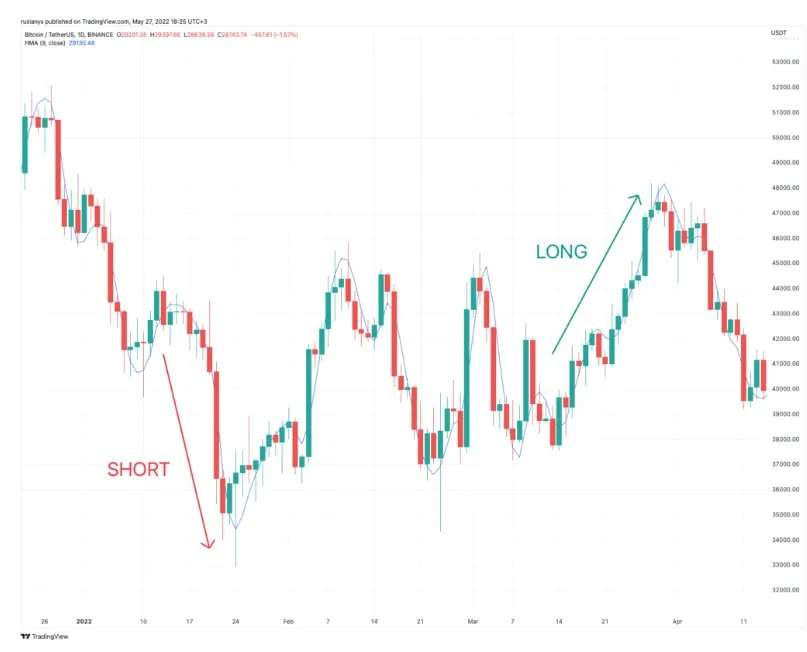
In practice, when the price crosses the Hal line from top to bottom, it can be a signal to open a short position, and when it crosses from bottom to top, it can be a signal to open a long position.
Strategies and combinations with other indicators
Any indicator is best used in combination with other analysis tools.
Use in conjunction with MACD and RSI
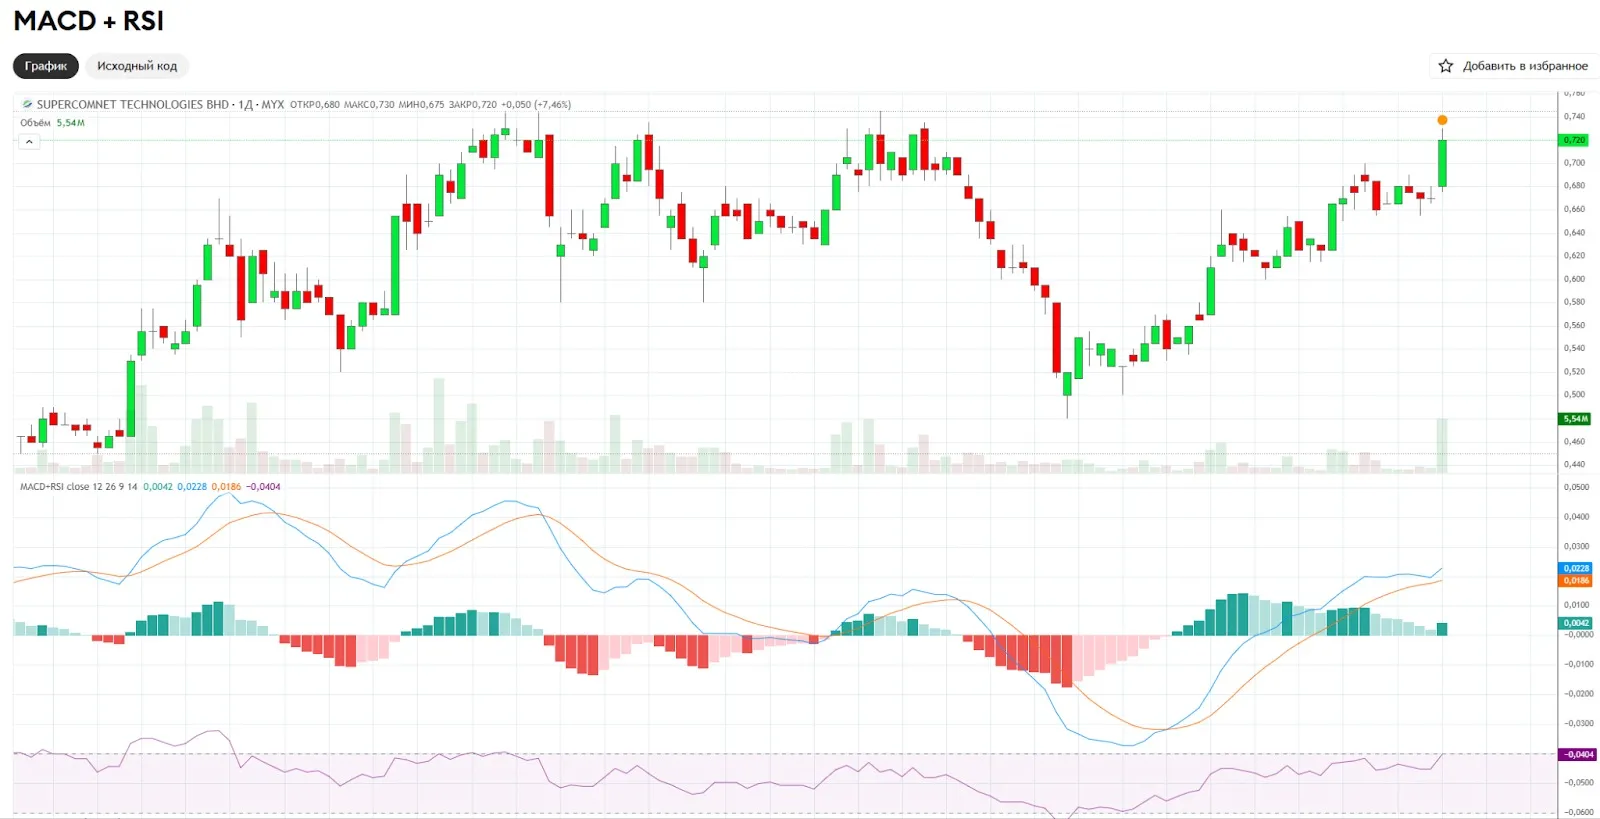
The combination of Hala + MACD (moving and moving crossovers) + RSI (overbought/oversold tracking) can provide a powerful signal to enter a trade. For example:
Price above Hal, RSI below 70, MACD shows an upward signal - opening a long position.
Price is below Hal, RSI is above 30, MACD is going down - shorting is possible.
How to use as a trend filter
A trend filter is a way to screen out trades that go against the current market direction.
Why the Hala line is suitable for trend filtering:
Speed: the HMA reacts quickly to price changes
Smoothness: eliminates “noise” and small fluctuations
Flexibility: easily adapts to different trading styles
Thanks to these properties, HMA is especially useful as a trend filter, i.e. as a tool that tells you whether you should open a trade at all and in what direction.
Practical application of HMA as a trend filter:
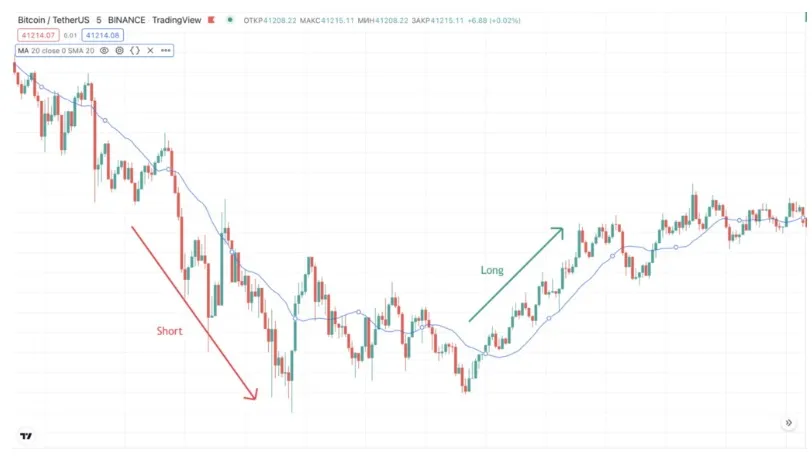
1. Determining the trend direction
HMA is directed upward → the trend is upward → only long trades are allowed.
HMA is pointing downwards → the trend is downward → only short trades are allowed.
HMA is moving horizontally → market is flat → signals should be ignored.
Example:
You are trading a level breakout strategy. The HMA is pointing upwards → so the breakout is considered only upwards. A downside breakout will be filtered out as “counter-trend”.
2. Combining with other indicators
The HMA can be used as a filter in combination with other oscillators or patterns. For example:
RSI gives a buy signal → check if the HMA is pointing up. If yes, the trade is allowed.
MACD shows a divergence → if the HMA is still pointing down, the signal is rejected.
Thus, the HMA cuts off potentially false signals based only on short-term fluctuations.
3. Enter trades only in the direction of the HMA
- If an entry in your strategy appears against the direction of the HMA, the trade is canceled.
- If the entry is in the same direction as the HMA indicates - the signal is considered valid.
This significantly increases the discipline of the system and eliminates trading “on emotions”.
What mistakes can occur during analysis?
-
Ignoring the market context (term bear market, bull market, flat, news).
-
Using without confirming indicators.
-
Over-optimization of parameters (over-learning).
-
Ignoring volumes and indicator of long and short positions.
FAQ
1. What is better to use: Hala moving average or SMA line?
If you want to react faster to market changes and minimize lag, the Hala moving average is a better choice. The SMA is the classic option, but it is slower.
2. Can Hala be used in a bear market?
Yes, it is especially effective as a signal filter for short positions or when there are open long and short positions that need to be closed correctly.
3. What is the best indicator to combine with Hala?
MACD, RSI, as well as volumes and indicator of long and short positions work well.
4. Is Hala suitable for trading cryptocurrency based on signals?
Yes, especially if the signals are based on technical analysis and trending strategies.
5. Where can I use Hala - on what timeframes?
On any timeframe: from 1-minute charts to daily charts. It all depends on your strategy and trading style.