
Support and resistance levels in trading
Support and resistance levels are one of the key tools of technical analysis that help traders make trading decisions. They reflect the balance between supply and demand in the market and allow to determine potential price changes. Let’s take a closer look at what support and resistance levels are, their types, methods of determination, as well as their practical application in trading.
Support and resistance levels - what they are, their types
The support level is a price zone where the asset stops decreasing due to an increase in demand. When the price approaches this level, market participants begin to actively buy, which prevents further decline. This level can be seen as a “floor” that keeps the price from falling.
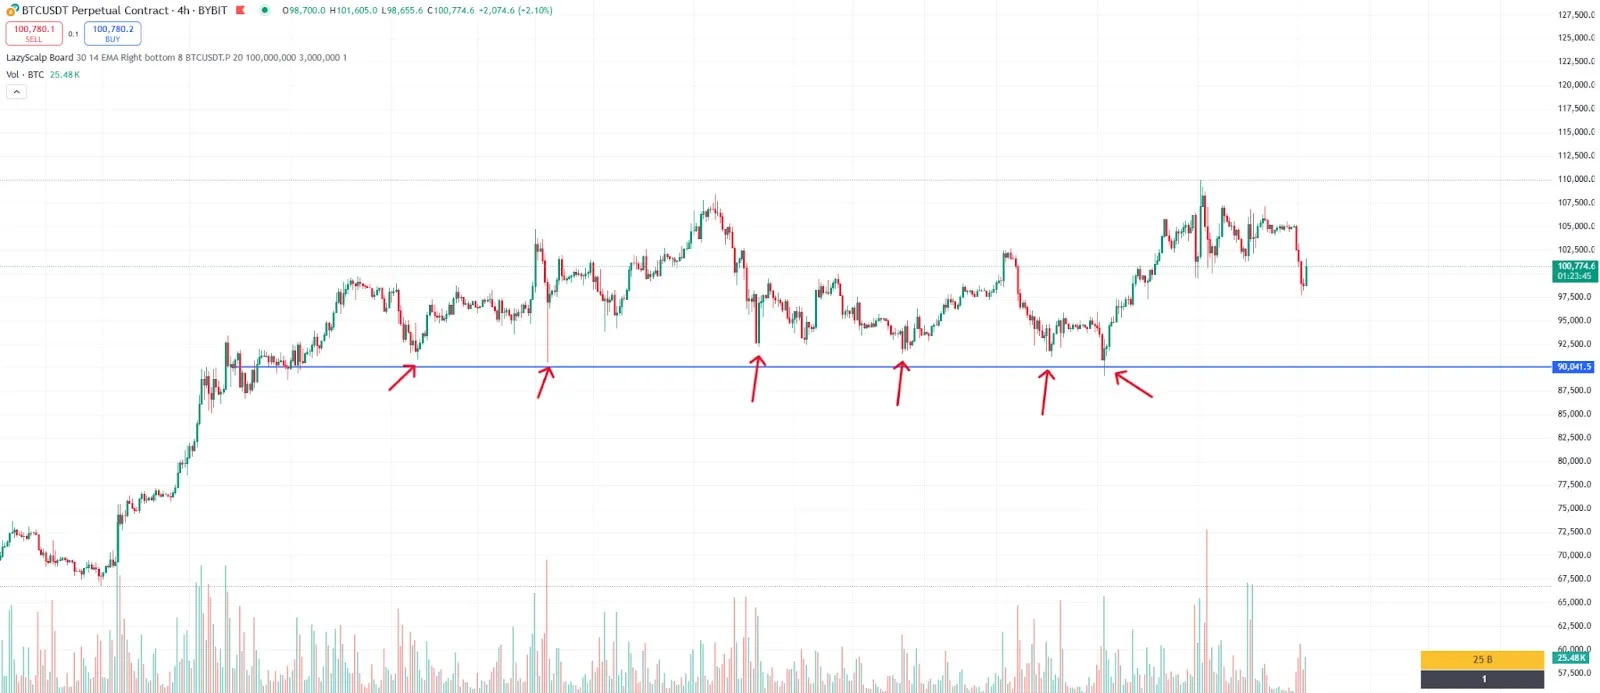
Resistance level is the price point where the growth of the asset slows down due to increased supply. Having reached this level, sellers begin to actively close positions, which limits further price growth. This level can be compared to a “ceiling” that restrains the price from rising.
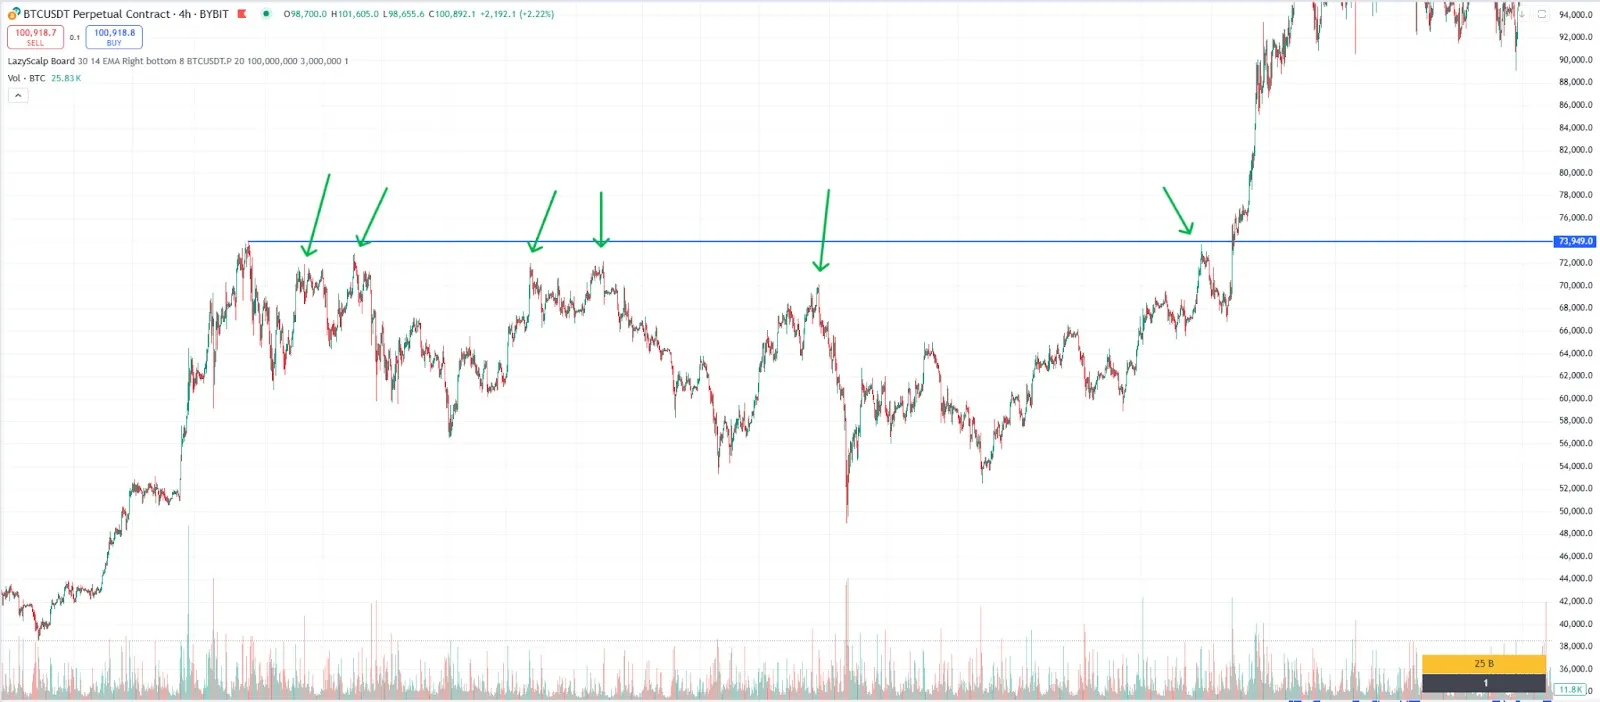
These levels are important benchmarks for traders, as they help to identify points of increased market supply and demand, as well as assess potential risks and profits.
Types of support and resistance levels:
1. Historical levels
Historical levels are formed based on past price movements. If an asset has tested a certain price level several times but failed to overcome it, it becomes a support or resistance level. For example, if the price of an asset has bounced off the $100 level several times, this level becomes a strong support.
2. Psychological levels
Psychological levels are round numbers that usually attract traders’ attention. For example, the $100, $500 or $1000 marks often become such levels because of the tendency of market participants to place orders around such values. These levels have no mathematical justification, but their significance is due to the behavior of traders.
3. Estimated levels
Estimated levels are built on the basis of mathematical methods and analytical tools. They include:
- Fibonacci levels: Used to identify pullback zones and trend continuation.
- Moving Averages (Moving Averages): Lines such as the 50-day or 200-day moving average often act as dynamic levels of support and resistance.
- Pivot Points: Calculated based on the high, low and closing price of the previous trading day.
Static and Dynamic Levels
- Static levels remain unchanged regardless of the time frame. For example, a resistance level at $200 would be static.
- Dynamic levels change depending on the market situation. They are often based on trend lines or moving averages.
How support and resistance levels are determined
1. Historical price extremes
Support and resistance levels are often formed in areas where price has previously stopped its movement.
-
Support levels are determined by previous lows.
-
Resistance levels are determined by previous highs.
Example: If the bitcoin price fell to $30,000 several times and bounced back, this indicates a support level. If it could not get past $50,000, this becomes a resistance level.
2. Technical indicators
-
Moving Averages.
-
Fibonacci Levels
-
Pivot Points
3. Trend Lines
-
Uptrend: A line connecting consecutive lows creates dynamic support.
-
Downtrend: A line connecting consecutive highs creates dynamic resistance.
4. Analyzing Trading Volumes
High trading volumes at support and resistance levels confirm their importance.
-
If the price bounces off a level on high volumes, it confirms its strength.
-
If the level is broken on low volumes, it may be a false breakout.
5. Analyzing candlestick patterns
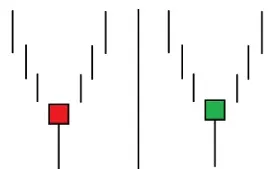
- Hammer: Signals an upward reversal at a support level.
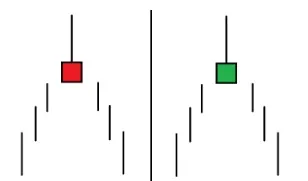
- Shooting Star: Signals a downward reversal at resistance.
6. Channels and horizontal lines
-
Channels: Formed by parallel support and resistance lines, showing the range of price movement.
-
Horizontal Lines: Captures the levels where price has most often stopped or bounced.
7. Combining Methods
Using more than one method increases the accuracy of levels. For example, a level that coincides with a historical low, confirmed by a Fibonacci line and high volume is considered more reliable.
How a resistance level becomes a support
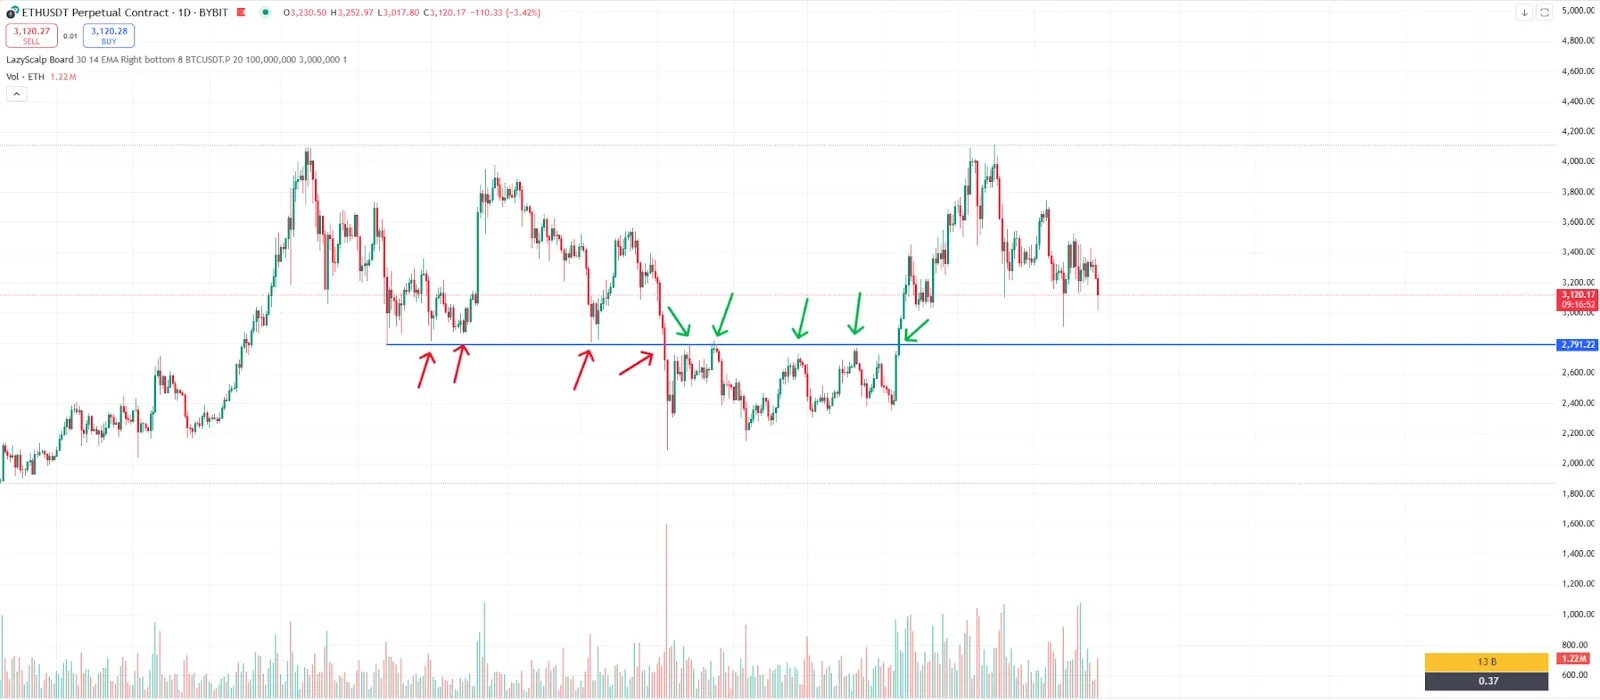
This process reflects a change in market sentiment and the balance of power between buyers and sellers. Let us consider its stages:
1. Price approaches resistance
When approaching a resistance level, the market faces increased selling as traders lock in profits or open short positions.
2. Breakout of resistance level
When buyers become more active, demand exceeds supply and the resistance level is broken. This is often accompanied by increased volume and positive news.
3. Testing the level for strength
After a breakdown under the action of the participants, the price may return to the resistance level to retest it. At this stage, sellers lose control and buyers begin to open positions.
4. Turning resistance into support
If the price bounces from the former resistance level, it becomes a new support. Market participants begin to perceive this level as a buying zone.
Support and resistance levels in trading
Almost no trading strategy can do without these levels:
Trading from levels
Traders open positions when the price bounces from a support or resistance level, setting a stop-loss behind the level. Thus, they have a clear stop-loss in the trade and a reason to enter.
Channel systems
Within a channel formed by parallel lines of support and resistance, traders take a position from the upper or lower boundary of the channel and wait for movement to the opposite boundary.
Relation of levels to other elements of technical analysis
Levels are often used together with trend lines, indicators (RSI, MACD and many others), candlestick patterns and volumes to confirm signals.
Conclusion
Levels are universal tools for any trading strategy, they show the ratio of market supply and demand at certain points on the price chart. Their correct definition helps to minimize risks and make an informed decision to enter a position. At the same time, you should understand the fact that no technical or fundamental analysis tool guarantees 100% accuracy, so you should always take into account market conditions and manage risks.
Frequently asked questions
- How to determine the exact support or resistance level?
Use a combination of visual analysis, indicators and volumes.
- Can I trade based on levels only?
Yes, but it is better to combine levels with other analysis methods to increase efficiency.
- What is a false breakout?
It is a situation when the price briefly breaks a level, but then returns to the same range.
- What tools help to identify levels?
Moving averages, Fibonacci levels, Pivot Points and other indicators.
- How can I tell if a level has been broken?
Pay attention to high volume and a candle closing above or below the level.