
Boggard strategy and secrets of trading volume analysis

There are many different strategies in the world of stock trading, but only a few of them allow you to effectively find promising opportunities amidst the general market noise. One of such strategies is Boggard, which is based on the analysis of trading volumes.
In this article we will take a closer look at the key indicators of this strategy, its working principle and give examples on historical data.
Strategy Description
The Boggard strategy is based on three key indicators:
1. Money Flow Index (MFI)
Description: Money Flow Index (MFI) is a tool for measuring capital inflows and outflows. It helps to assess the intensity of capital flows in an asset by analyzing trading volumes and the difference between typical period prices. MFI helps identify trends and potential pivot points, providing traders with valuable signals for decision making.
How it works:
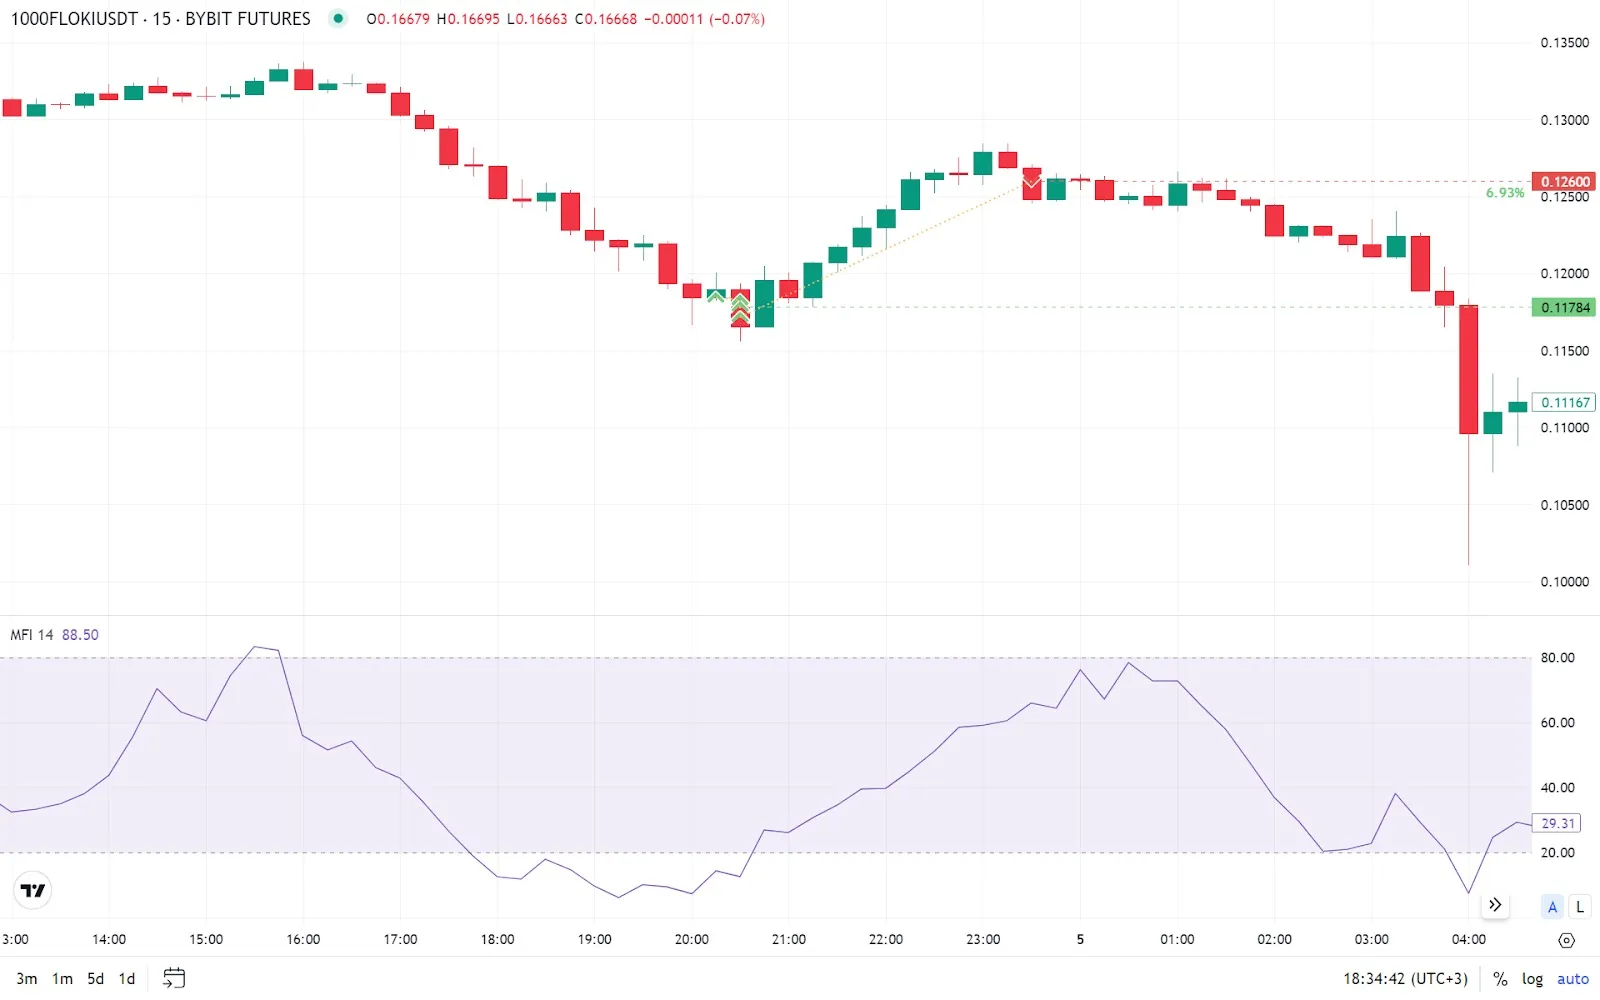 MFI helps identify when trading volumes are rising or falling. This allows you to understand exactly when funds are entering or exiting an asset and when the market changes its mood.
Application in the strategy: Let’s set MFI on our main working timeframe - m15, choosing the standard value for the oversold zone for this oscillator - “less than 20”. As an additional filter for entry points, let’s set the same indicator on the auxiliary timeframe - m5 with the same condition - “less than 20”.
2. Average Directional Index (ADX)
Description: Average Directional Index (ADX) is a tool that measures the strength of a trend regardless of its direction. ADX helps to identify when a trend is gaining or losing strength, allowing traders to enter and exit trades in a timely manner.
How it works:
-
The +DI line (positive direction of movement): Shows the average of positive price changes over a certain period.
-
-DI line (negative direction of movement): Shows the average of negative price changes over the same period.
-
Average line (ADX - we need it): Shows the strength of the trend, calculated as the average of +DI and -DI.
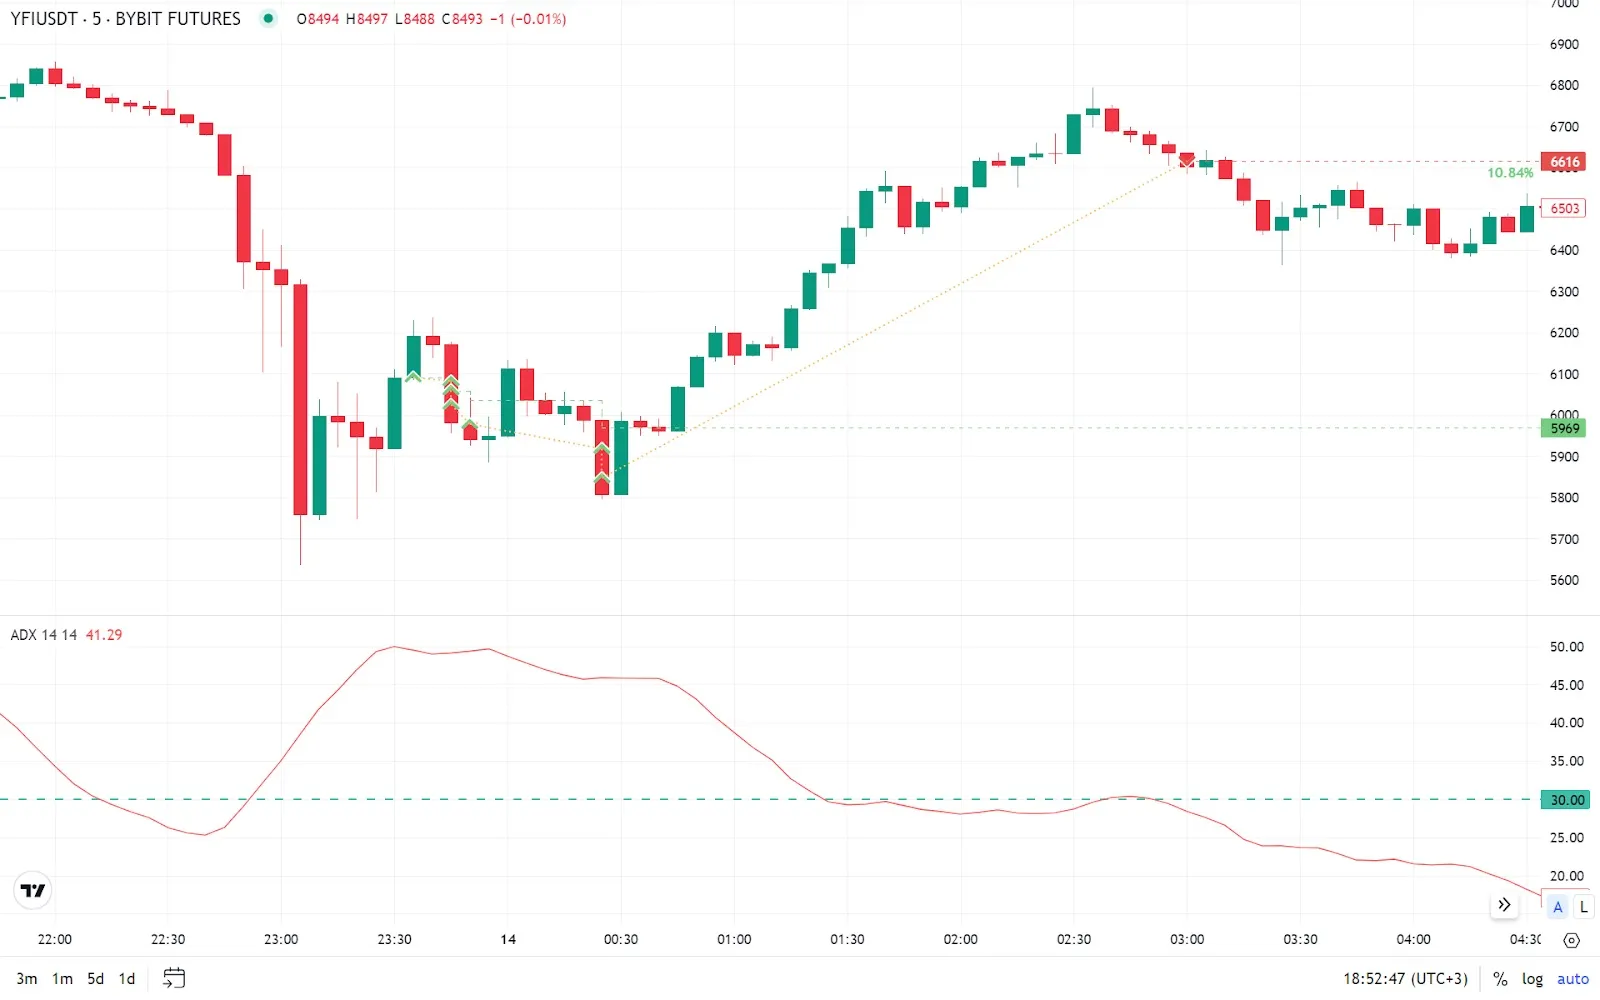
Application in the strategy: We use the ADX indicator with a value of more than 35 on a time frame of 5 minutes. This allows us to catch powerful short-term impulses.
3. Chaikin Oscillator (CHO)
Description: The Chaikin Oscillator (CHO) is a tool that takes into account not only price changes, but also shows how fast volume changes. If the volume grows on LONG candles, the fast moving average starts to move faster relative to the slow moving average, and the oscillator line goes up. Conversely, if the volume grows on SHORT candlesticks, the indicator line moves downward.
How it works:
-
The oscillator line crosses the zero level from bottom to top - a buy signal.
-
The line crosses the zero level from top to bottom - a sell signal.
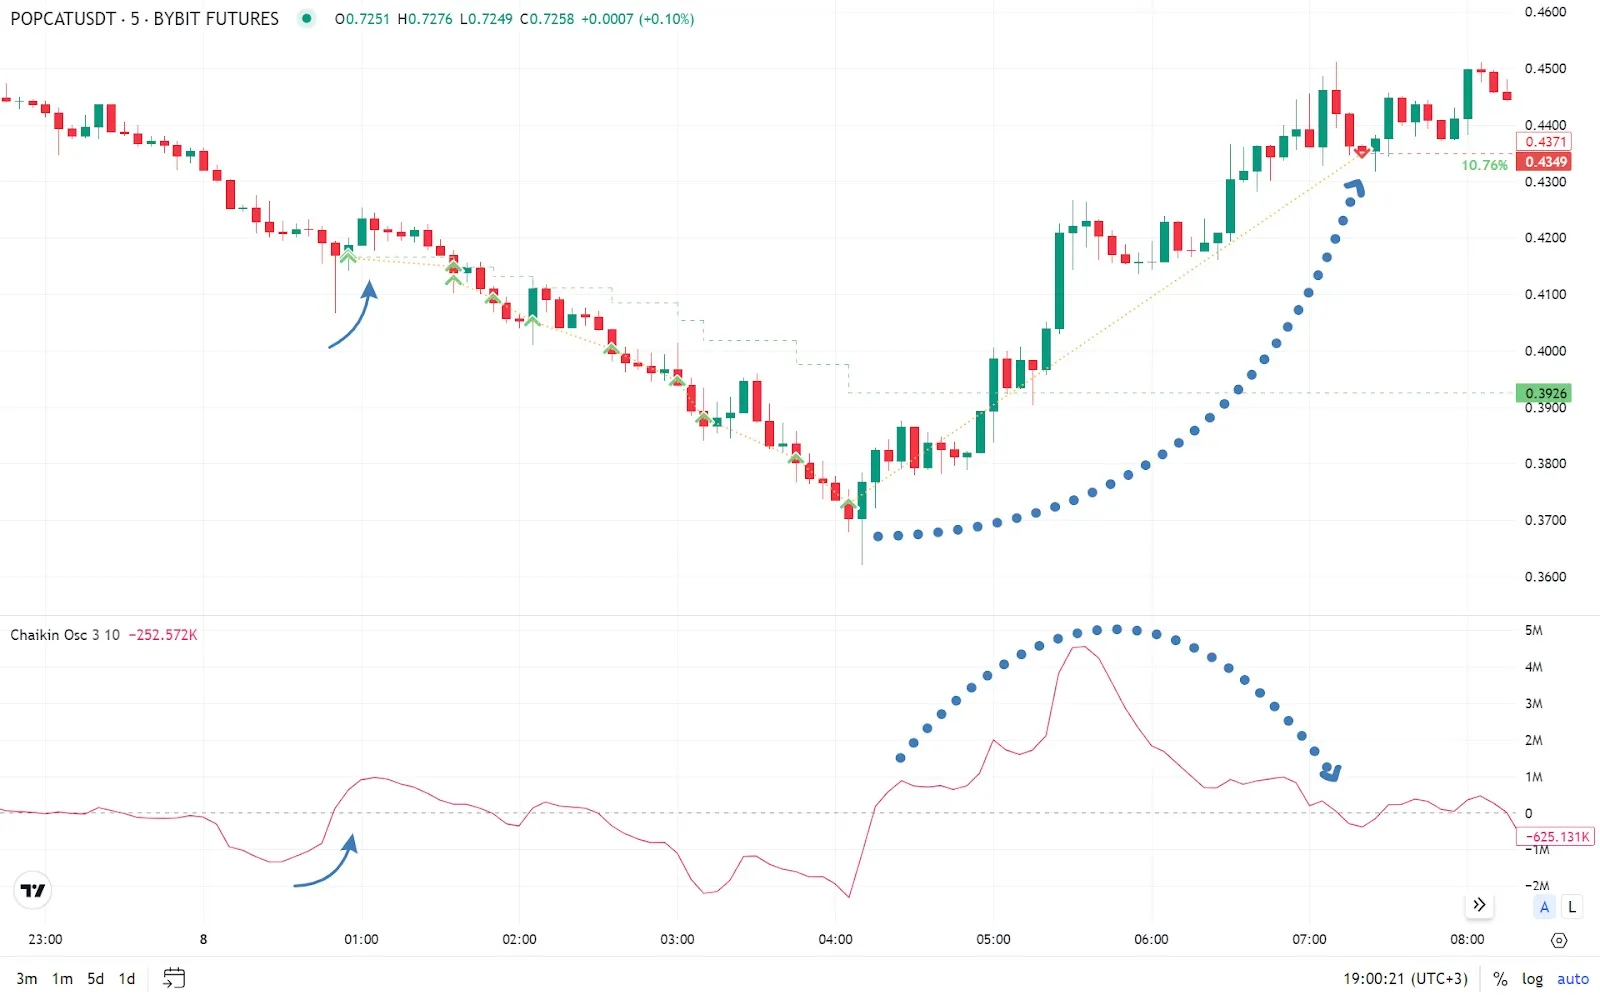
Application in the strategy: When the oscillator line crosses the zero level from bottom to top on the M5 timeframe - open a buy trade. When we cross the same level a little later from top to bottom - fix the profit.
Building the grid and nuances
Let’s make a backtest of the Boggard strategy on history, taking the following assets:
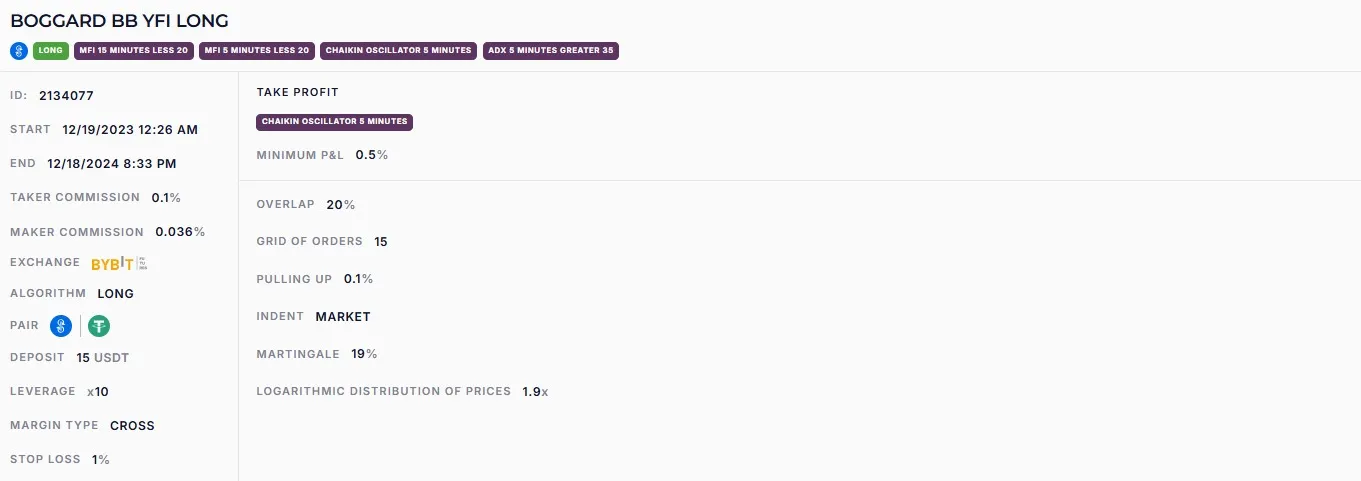
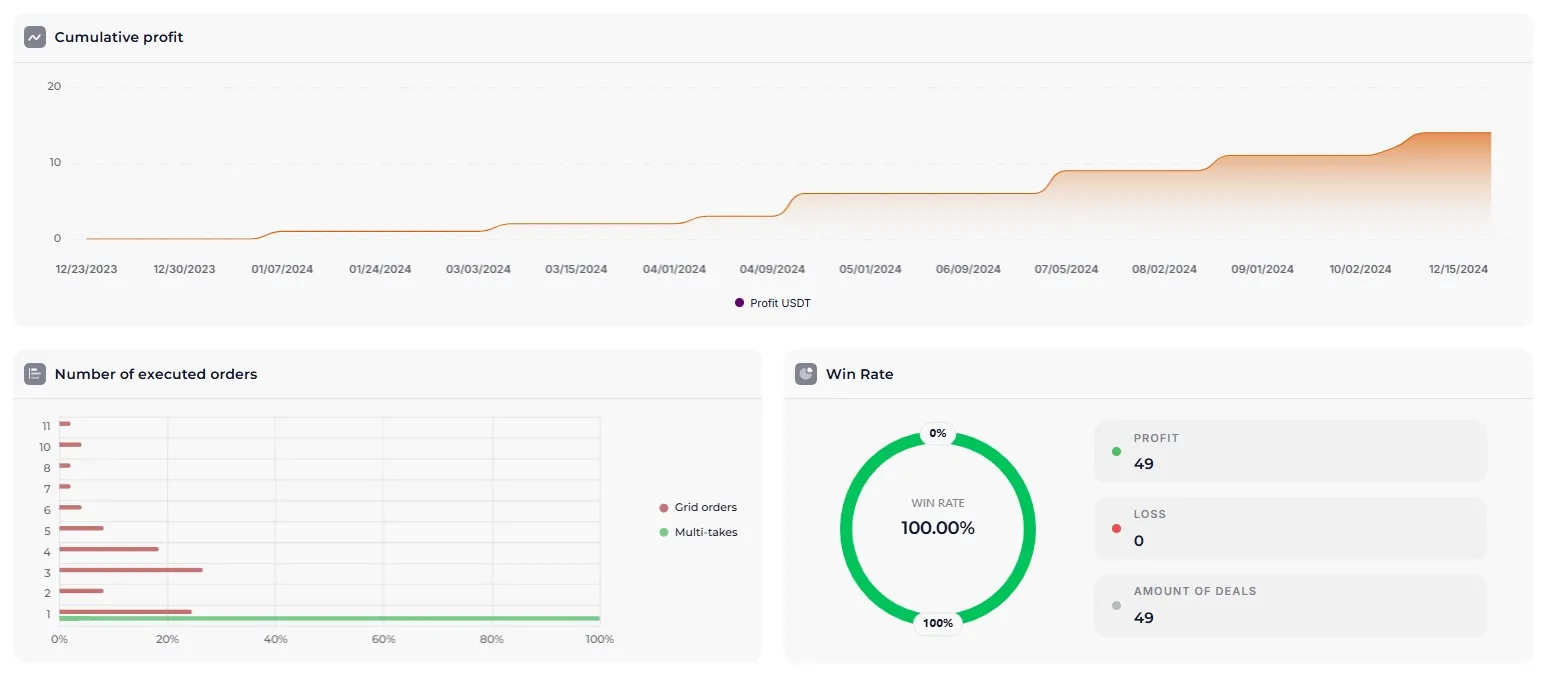
BOGGARD BB YFI LONG (~86.6% p.a.)
https://veles.finance/share/yJRQJ
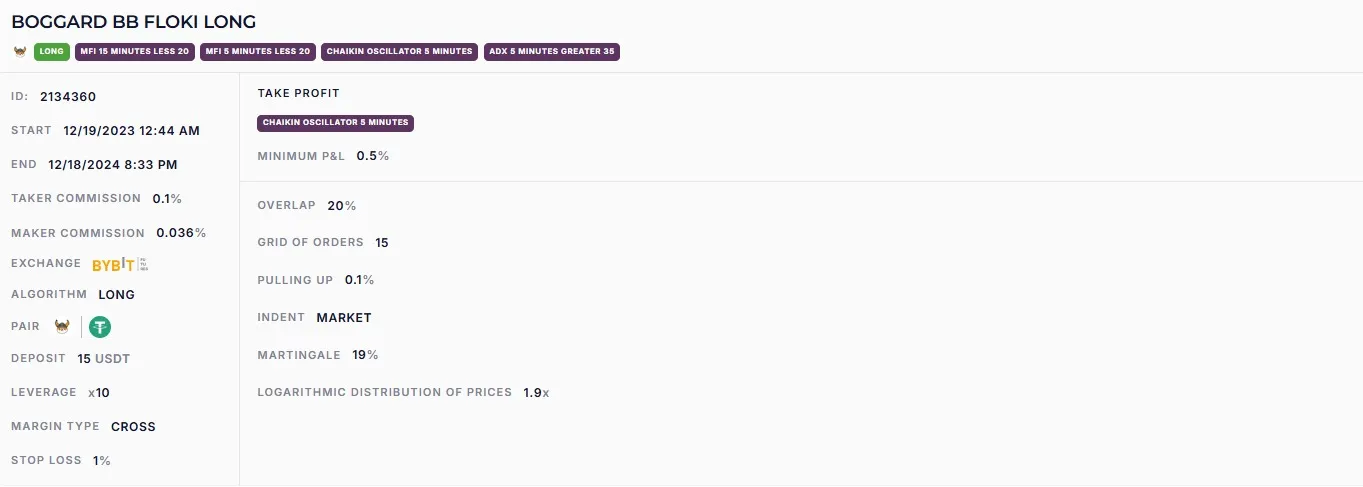
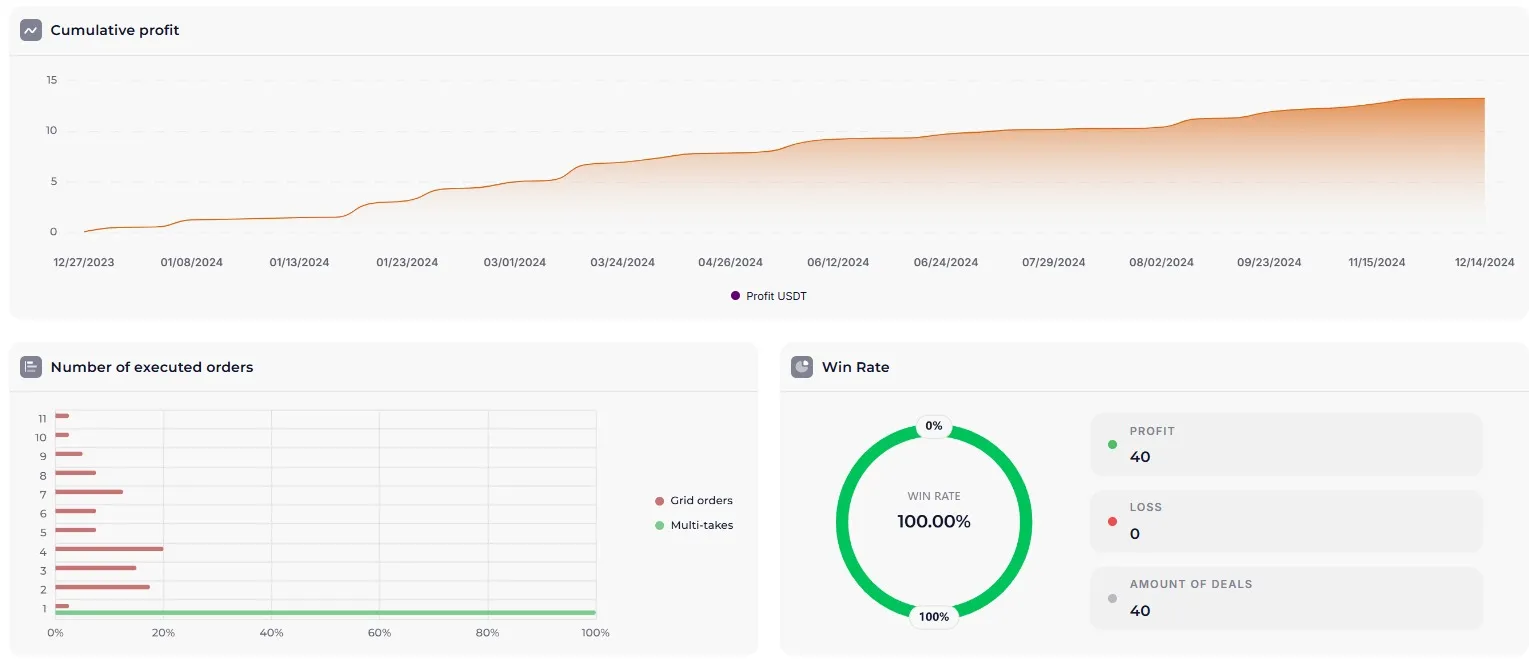
BOGGARD BB FLOKI LONG (~80.8% p.a.)
https://veles.finance/share/WfSWv
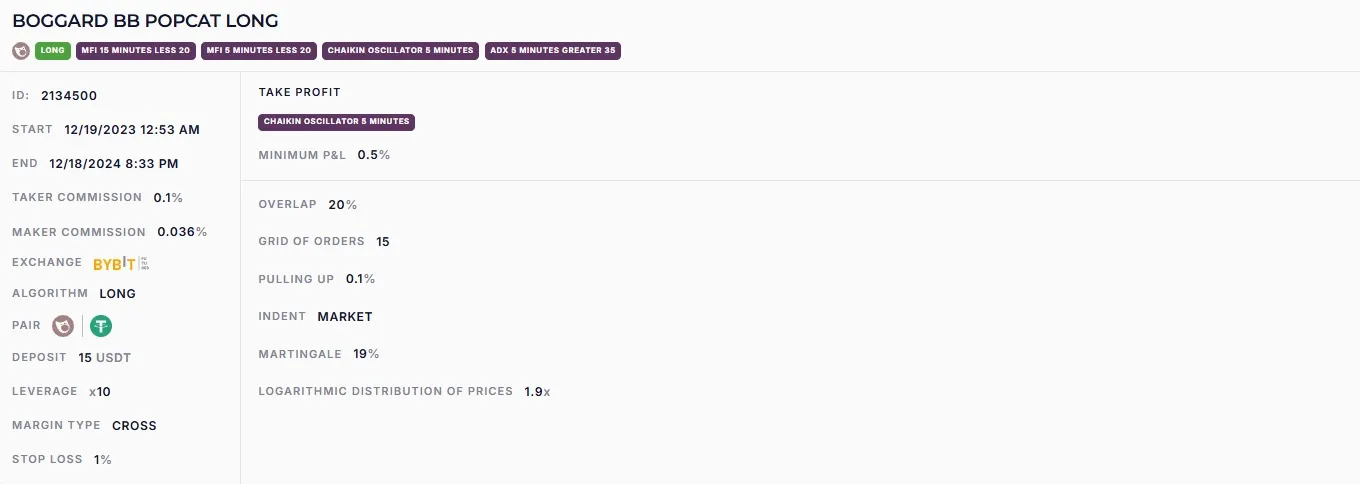
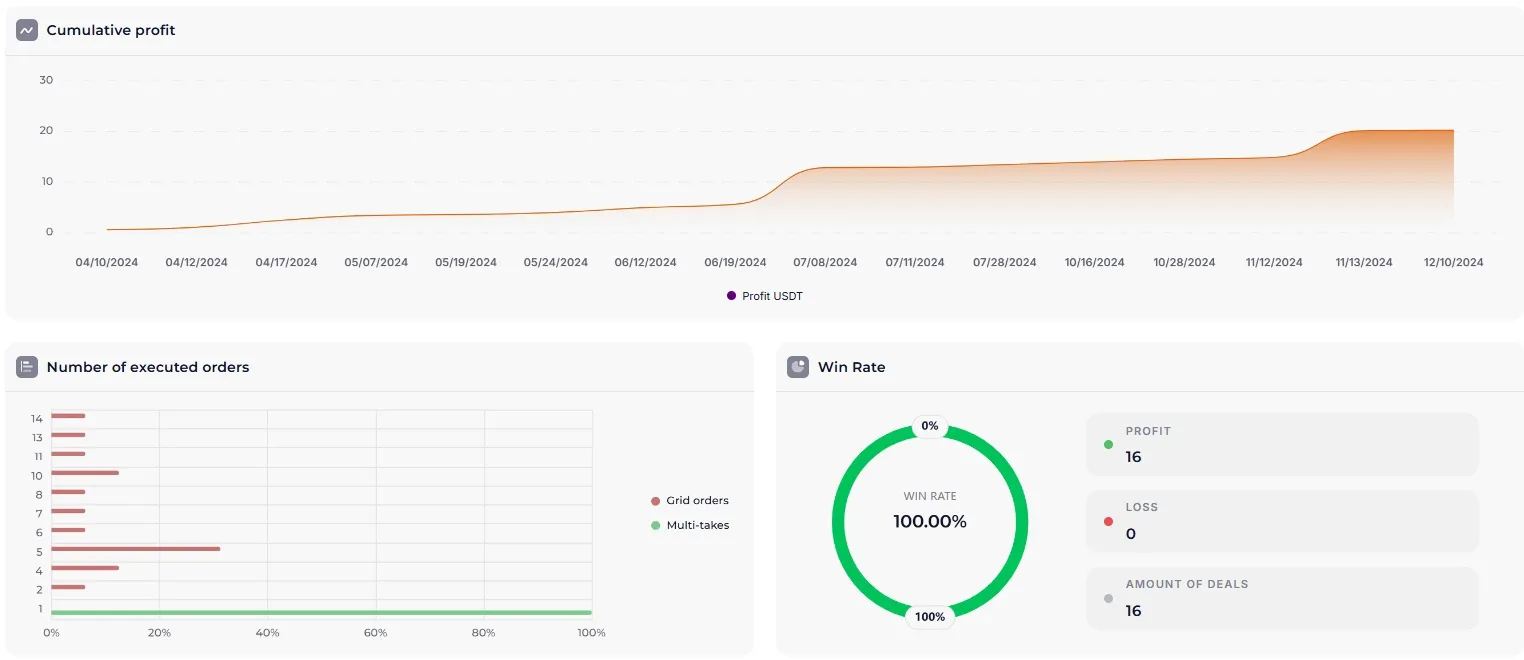
BOGGARD BB POPCAT LONG (~128.6% p.a.)
https://veles.finance/share/TVbfk
Testing confirmed that the trading strategy takes into account trading volumes and shows positive results. It helps traders make informed decisions, minimize risks and profit from market fluctuations.
Before using the Boggard strategy, it is important to conduct a detailed analysis and backtests on historical data of other assets. This will help to understand how the strategy has worked in the past and avoid risk-related mistakes. Do not risk more than 1% of your deposit on a single bot run to preserve capital.