
«Grid warlord»: profit is your ally, and the market is the battlefield

Imagine that in front of you is an experienced commander, experienced in the art of conducting military campaigns. He knows how to read a situation like an open book and find the best way out of the most difficult situations. His decisions are always well thought out, and his tactics are effective. The Grid warlord strategy is based on the use of indicators that are easy to understand and interpret. Using strong trend movements and reverse indicator signals to open positions allows you to effectively manage risks and minimize losses.
Description of the strategy
This strategy is based on the use of several indicators to determine the entry and exit points of trades. Here’s how it works:
1. Average Directional Index (ADX)
Description: The Average Directional Index is an oscillator developed by Wells Wilder and helps determine the strength of a trend.
How it works:
-
Line +DI (positive direction of movement): Shows the average value of positive price changes over a certain period.
-
Line –DI (negative direction of movement): Shows the average value of negative price changes over the same period.
-
The average line (ADX - we need it): Shows the strength of the trend, calculated as the average value of +DI and –DI.
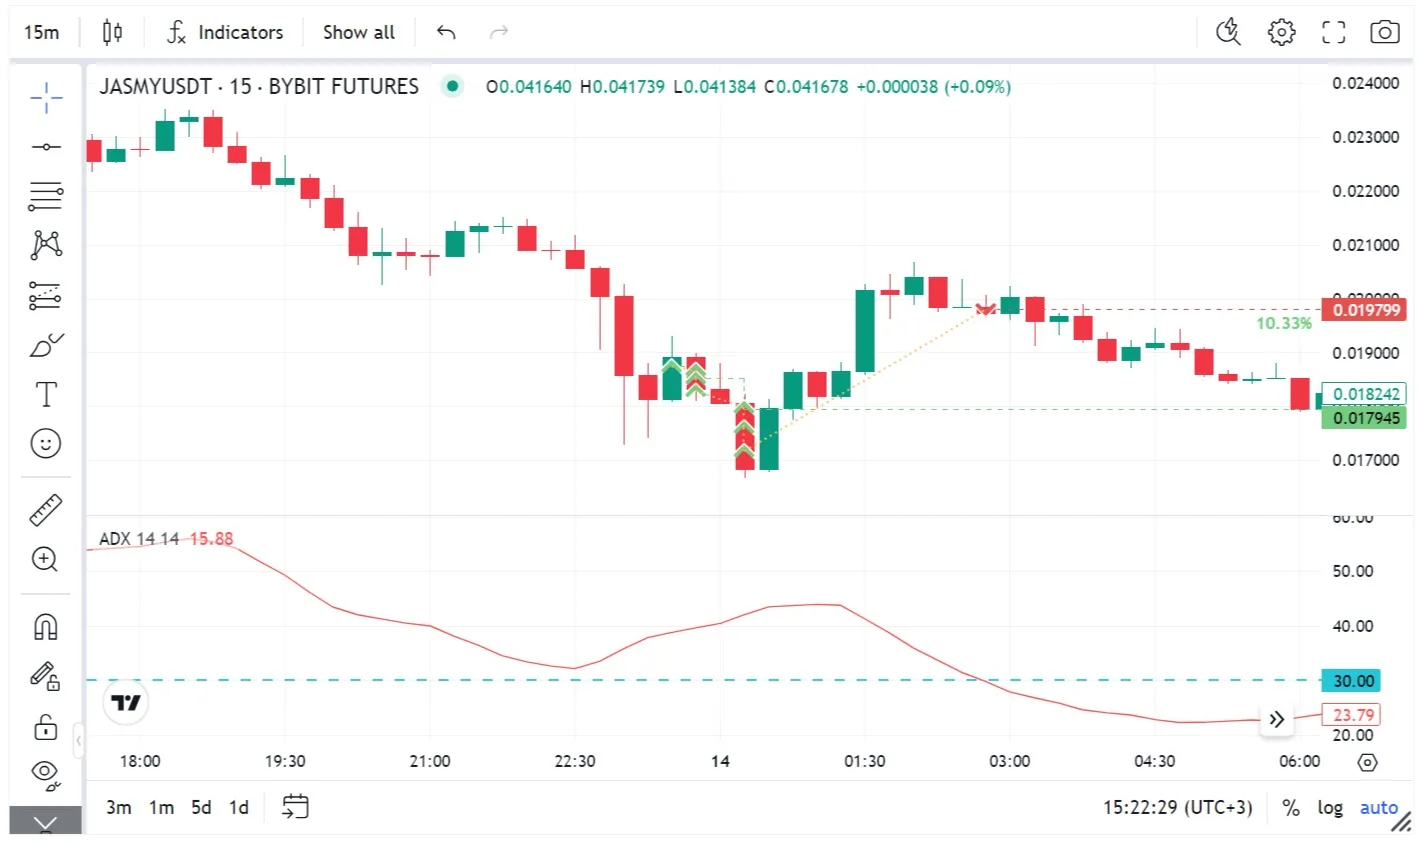
Application in the strategy:
- We use an ADX value greater than 30 on the m15 timeframe. This indicates a strong trend, which makes transactions as safe as possible in the context of stock trading.
2. Chande Momentum Oscillator (CMO)
Description: Chande Momentum Oscillator is an indicator developed by Tushar Chande that compares the current closing price with the closing price for a certain period of time and calculates the difference between them. This difference is then smoothed out using a moving average. The result is an oscillator that ranges from -100 to +100.
How it works:
Oversold and overbought levels are determined by the standard levels of -50 and +50.
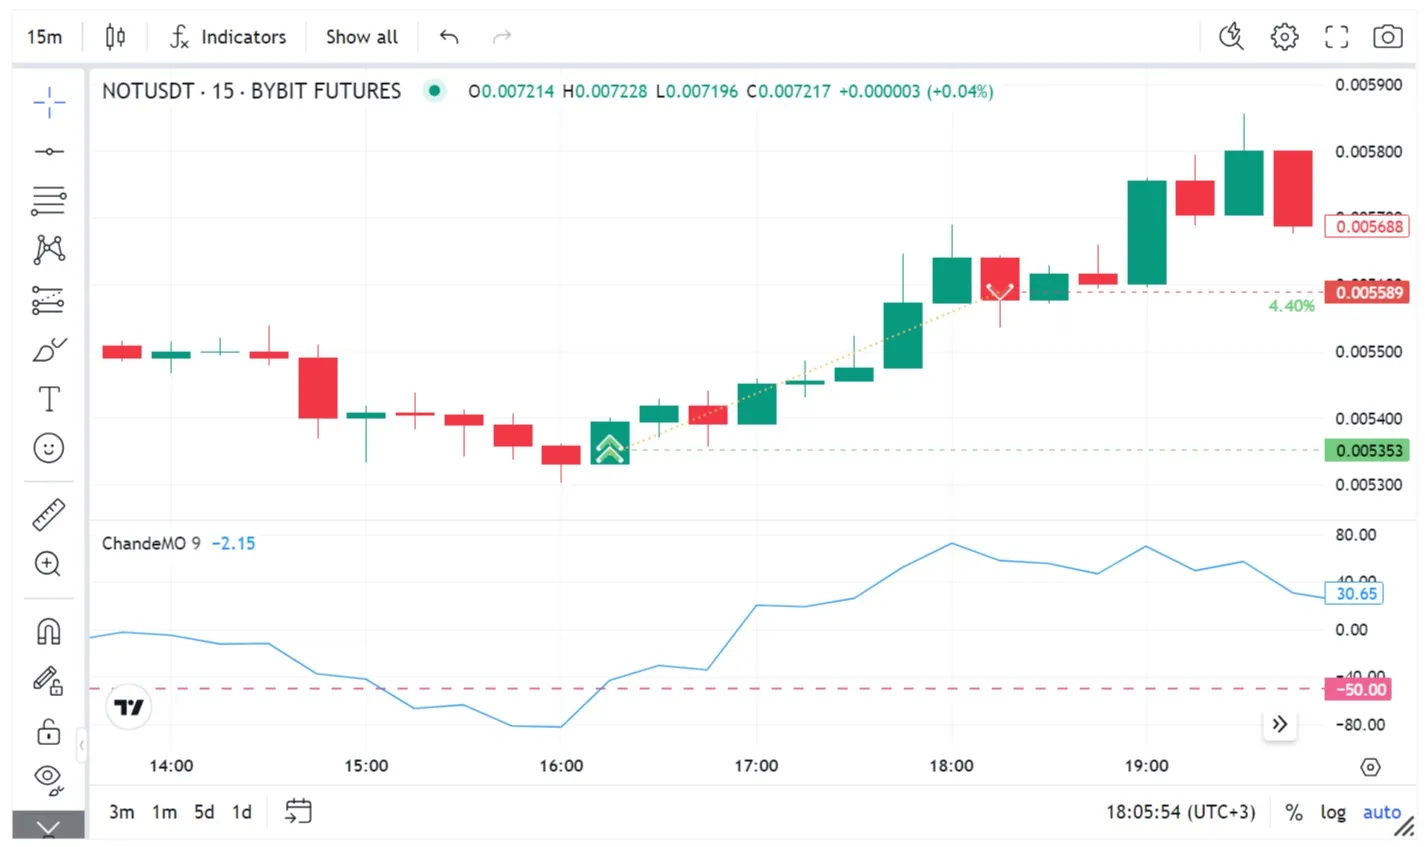
Application in strategy:
- When the oscillator is in the negative range, it indicates that the current closing price is lower than the closing price for a certain period of time, which in turn may indicate a downtrend or that the market is oversold and a recovery may occur soon. We use the standard level of -50 on the m15 timeframe: we will trade from oversold and try to enter a deal on a potential upward reversal.
3. Bollinger Bands
Description: Bollinger Bands is an indicator introduced by John Bollinger that helps determine market volatility and, just like the previous oscillator in the strategy, potential trend reversals.
How it works:
- It consists of three lines:
- The central line (MA): the 20-period exponential moving average (EMA) of the closing price.
- Upper band: Calculated as the center line + 2 standard deviations.
- Lower band: Calculated as the center line – 2 standard deviations.
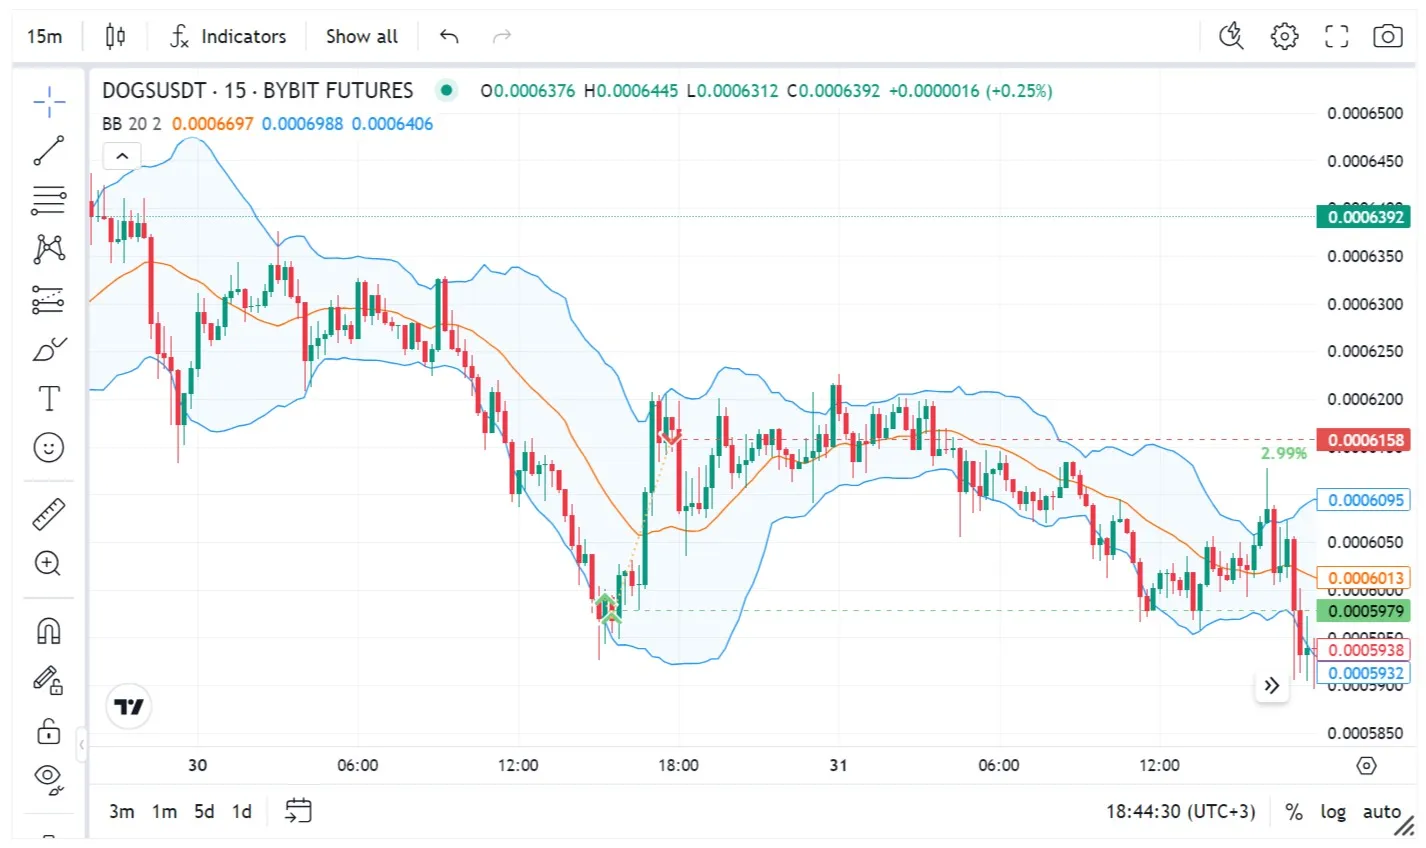
Application in strategy:
- We use Bollinger Bands on the m15 timeframe. When the price approaches the lower band, this may confirm the oversold zone and indicate a likely upward reversal.
4. Donchian Channel
Description: The Donchian Channel is an indicator proposed by Richard Donchian that helps determine the price range in the market and potential support and resistance levels. In the early 1970s, it was called the Sliding Channel, but was subsequently renamed in honor of its creator.
How it works:
-
It consists of upper and lower lines, which are based on the maximum and minimum prices for a certain period (for example, 20 days).
-
The upper line is based on the maximum prices for this period.
-
The bottom line is based on the minimum prices for this period.
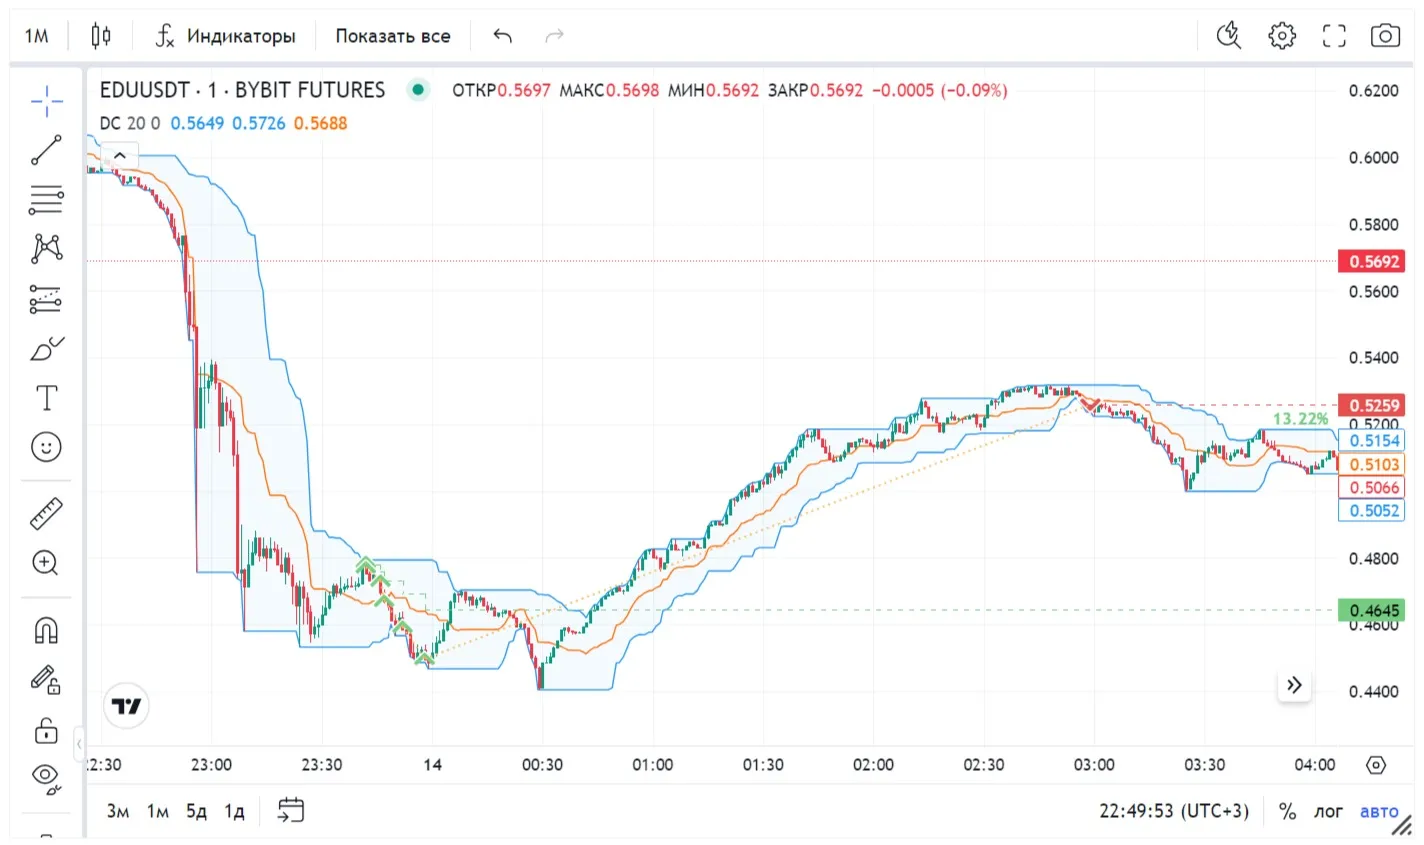
Application in the strategy:
- Let’s use it to determine potential support and resistance levels, as well as a trend reversal on one of the lowest timeframes - m1. When the price breaks through the upper line, it may indicate the beginning of an uptrend.
Having 3 confirmations to enter the transaction, we can try to maximize profits by “pulling” a good movement from these points.
Description of the exit signal
Supertrend is an indicator that helps to identify a trend change and can serve as a signal to exit a trade.
How it works:
-
Supertrend is based on a moving average that smooths out price fluctuations.
-
When the Supertrend changes direction (price crossing + indicator color change), it indicates a trend change.
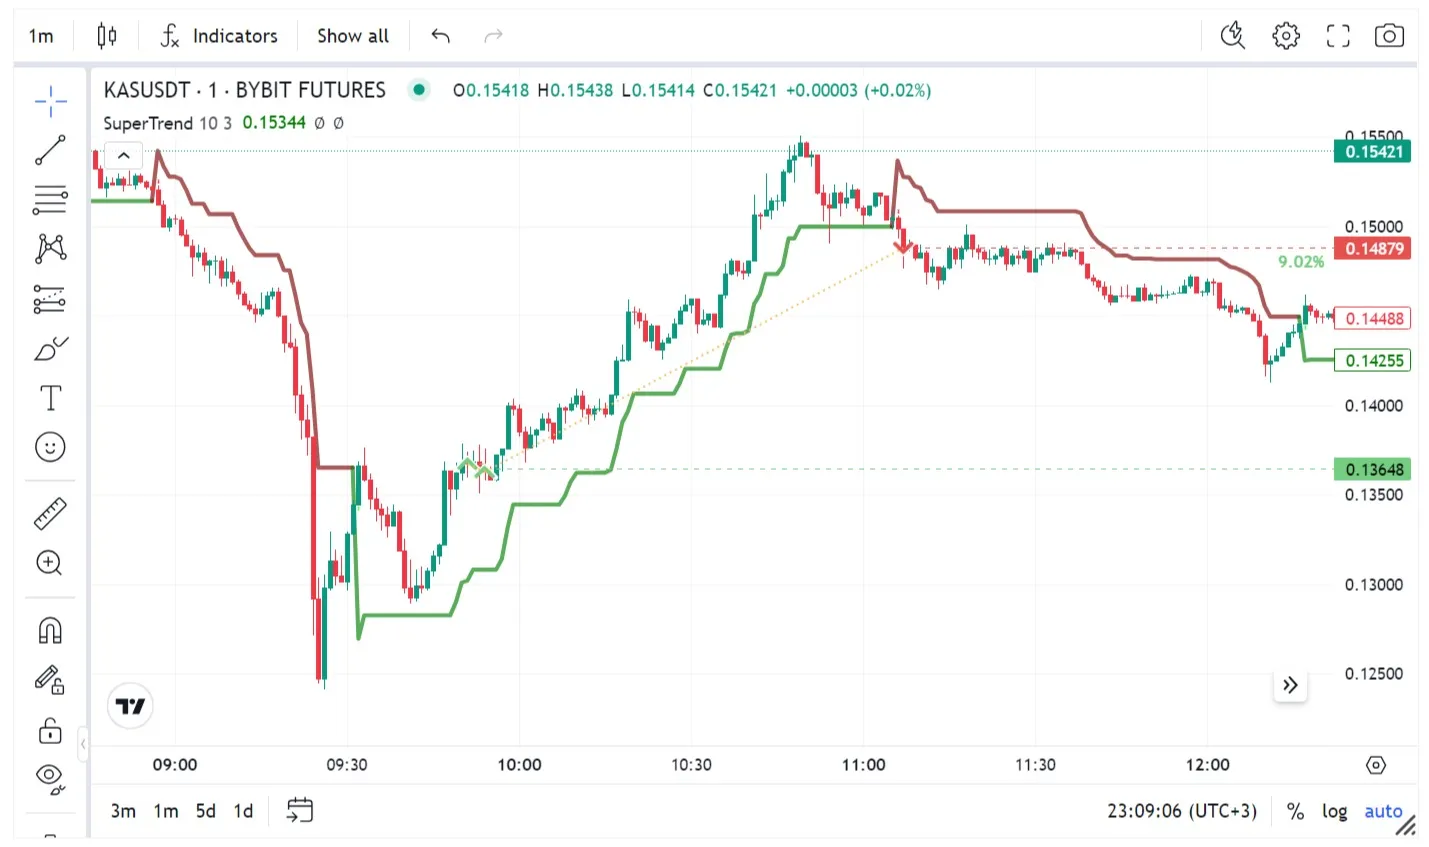
Application in strategy:
- The exit from the transaction is carried out by the “trend change” signal from the Supertrend indicator. This means that if the Supertrend was pointing up and started moving down, it could be a sell signal. If the Supertrend was directed downwards and started moving up, this may be a buy signal.
Note that this strategy is highly adaptable and versatile, since the parameters can be easily adjusted to reflect the current market environment. In addition, it is applicable to a wide range of assets. To understand how the system works, it is recommended to start the test with a small deposit - do not rush to increase it. It is better to do this gradually, focusing on your financial capabilities.
Grid warlord results based on historical data

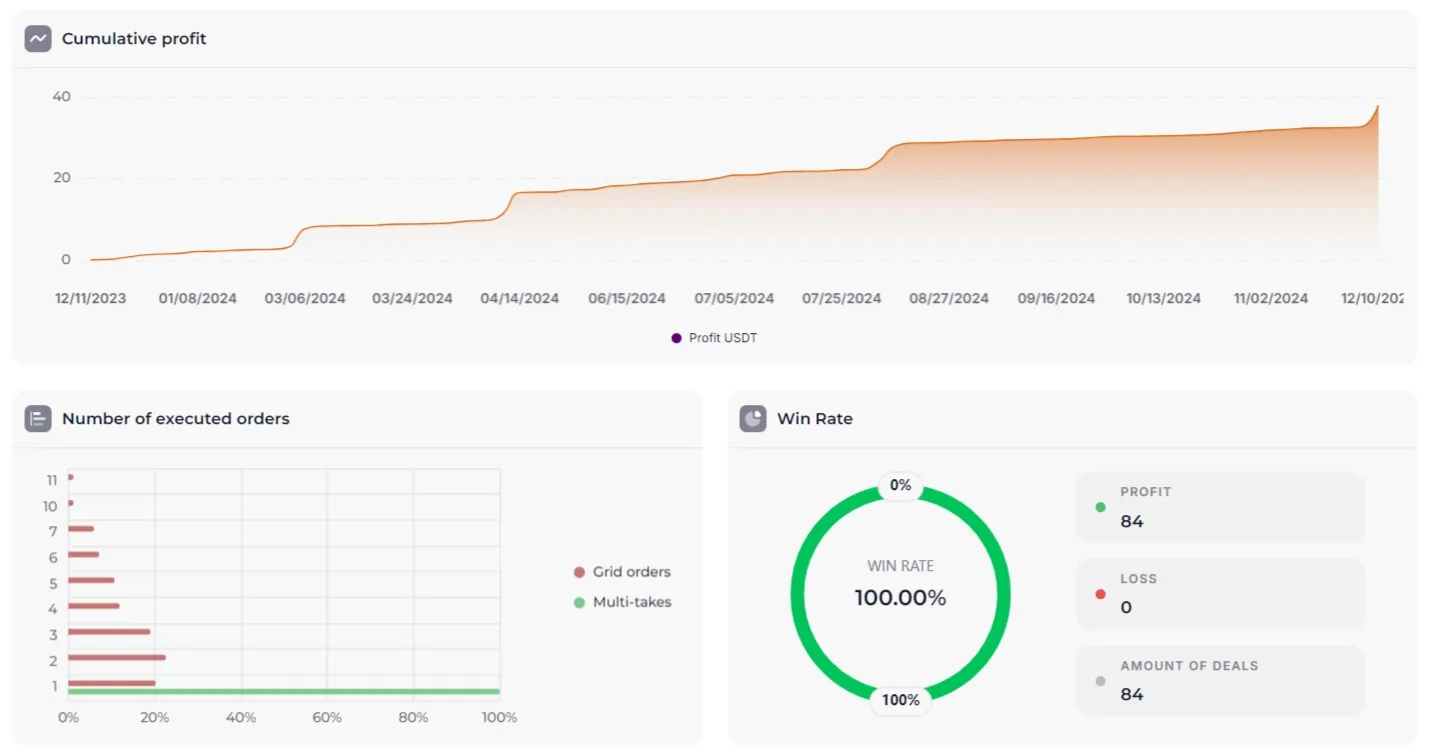
BYBIT JASMY GRID WARLORD 2.0 (~236% per annum)
https://veles.finance/share/EFNbP

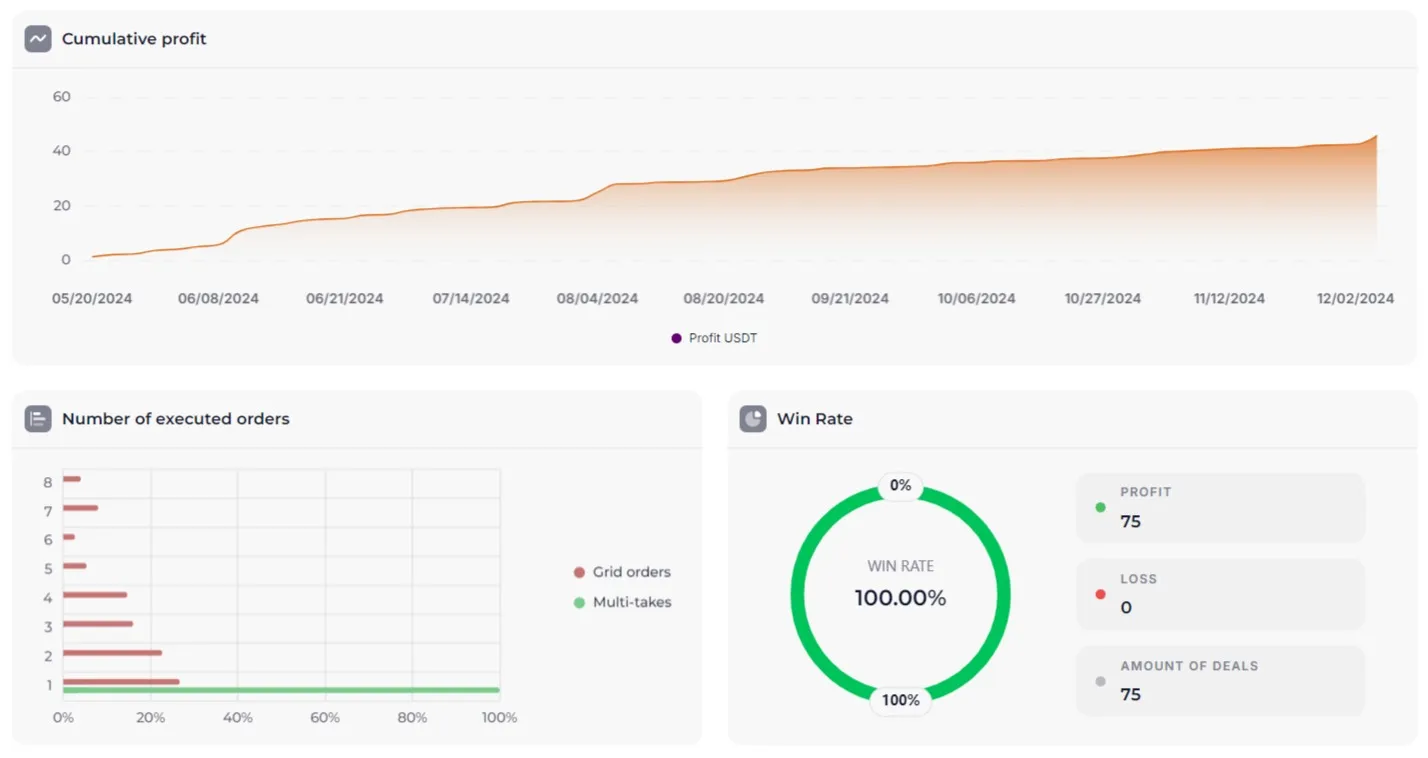
BYBIT NOT GRID WARLORD 2.0 (~277% per annum)
https://veles.finance/share/PxfuG

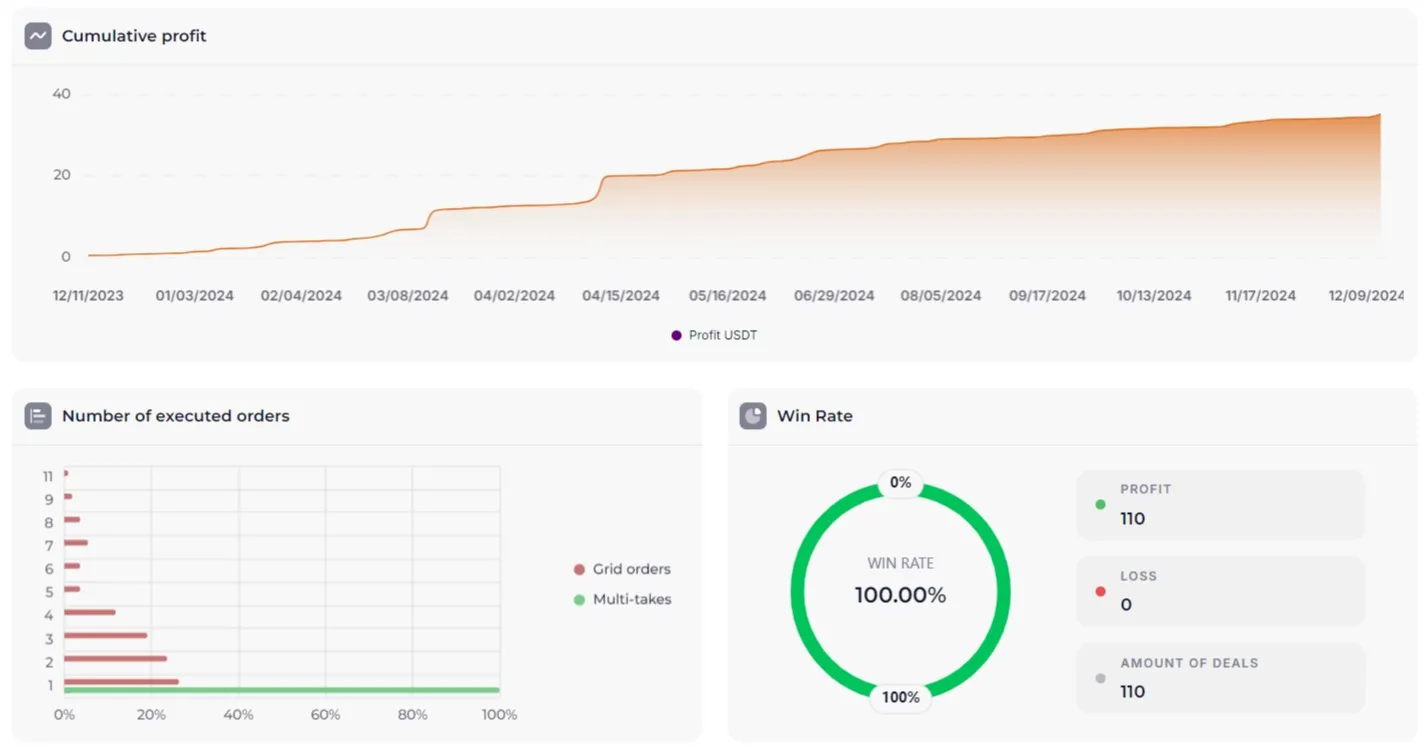
BYBIT EDU GRID WARLORD 2.0 (~212% per annum)
https://veles.finance/share/KUEYZ
Conclusion
We are convinced that this trading system will become an indispensable assistant for traders seeking simple and effective methods of trading on the market. Flexible grid parameters allow you to adapt it to individual risk and money management, which makes it universal for most assets and deposits, from modest to impressive. However, before you start using it, it is strongly recommended to conduct your own analysis (DYOR) and check on the backtests.
Let your every step in the market be confident and your trades profitable!