
Money Flow Index
How to Use the Money Flow Index (MFI)
In trading, there are many proven indicators. However, only a small portion of them analyze information based not only on the asset’s price but also on other metrics, such as volume. The Money Flow Index is exactly such an indicator.
What is the Money Flow Index (MFI)
Money Flow Index (MFI) — is one of the technical indicators. It evaluates the inflow and outflow of capital into an asset, taking into account both price and volume. It is often called an “improved version of RSI” because, unlike RSI, which analyzes only price movement, the Money Flow Index MFI also includes trading volumes in its calculation. Thanks to this, it is considered one of the best indicators for crypto, where activity and liquidity are equally important.
Money Flow Index helps traders understand where capital is moving. Is it entering the market (buying) or exiting it (selling). The Money Flow Index essentially shows the hidden sentiment of market participants and can signal upcoming price reversals.
How the Money Flow Index is Calculated
The MFI formula is built in several stages:
- First, the typical price of an asset is calculated using the formula (High + Low + Close) / 3.
- Then it is multiplied by trading volume — resulting in money flow.
- After that, it is divided into positive (when price rises) and negative (when price falls).
- Based on the ratio between them, the final value of the Money Flow Index indicator is calculated, which always ranges from 0 to 100. MFI combines price and volume data, making it a valuable tool among other cryptocurrency trading indicators.
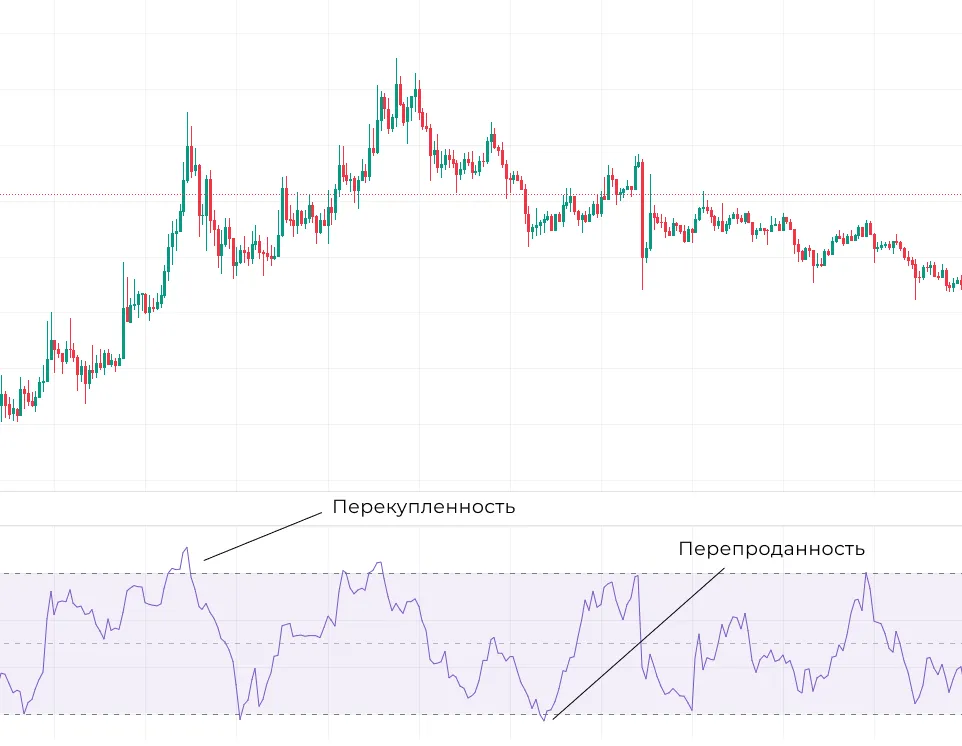
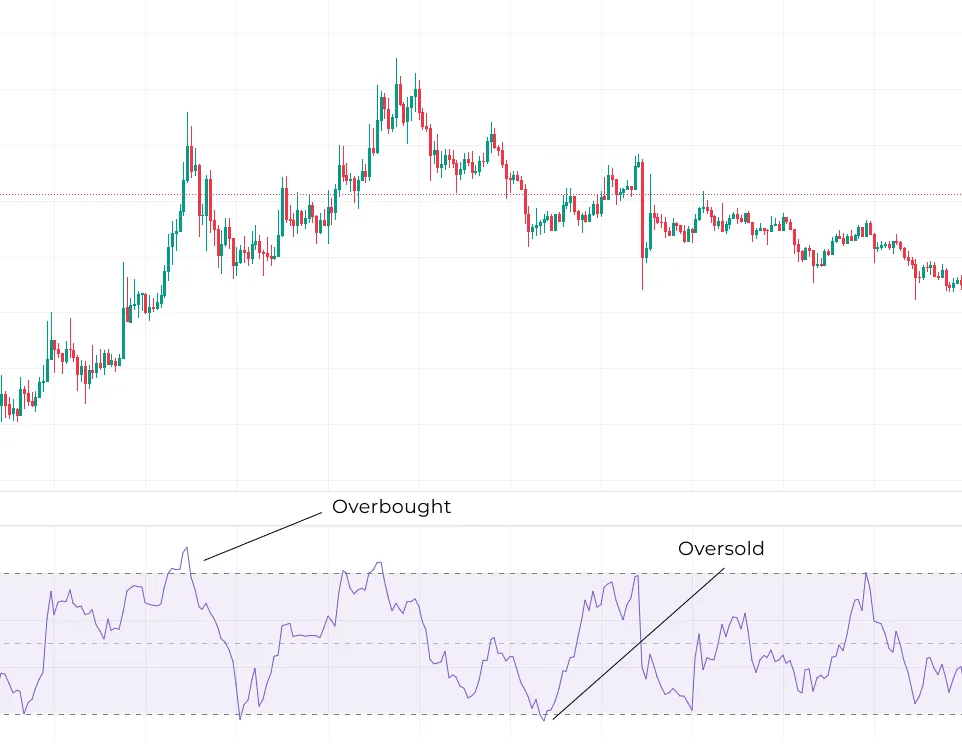
How to Interpret MFI Values
When MFI is in the lower zones (usually below 20), it indicates that capital is actively leaving the market and the asset is in an oversold condition. In such situations, many traders begin to look for entry points to buy, expecting a technical bounce or the start of a new upward impulse. However, it is important to consider the overall market context. For example, a strong downtrend can continue even with low MFI, so confirmation by other indicators in such cases will be mandatory. If MFI rises above 80, the market enters a state of overbought. In this case, too much capital has flowed into the asset in a short time, and there is a risk of correction. Often, it is at such points that those who bought earlier take profits. This situation leads to a slowdown in growth or even a reversal.
Special attention is paid to divergences. For example, the price updates a new high, but MFI shows lower values — this is a signal of trend weakening. This situation indicates that money is entering the market with less intensity, and the probability of a reversal increases. The same logic works in reverse. If the price updates lows while MFI rises, a bounce can be expected.
It is also important to consider average Money Flow Index values. The range between 40 and 60 is usually considered an equilibrium zone when there is no pronounced pressure from either buyers or sellers in the market. During such periods, the asset most often moves in a sideways trend, and therefore MFI signals will be less significant.
The cryptocurrency market is characterized by high volatility, so false breakouts, overbought or oversold conditions occur quite frequently. Therefore, experienced traders use MFI not as the only source of signals, but as a filter to confirm trend strength. In particular, if the indicator value exits the oversold zone and consolidates above 30, this can be a signal for the start of an upward movement. And if after overbought conditions MFI drops below 70, this indicates that the market is gradually cooling down. Based on the situations discussed above, interpreting the Money Flow Index MFI comes down not only to simple levels of 20 and 80, but also to analyzing dynamics.
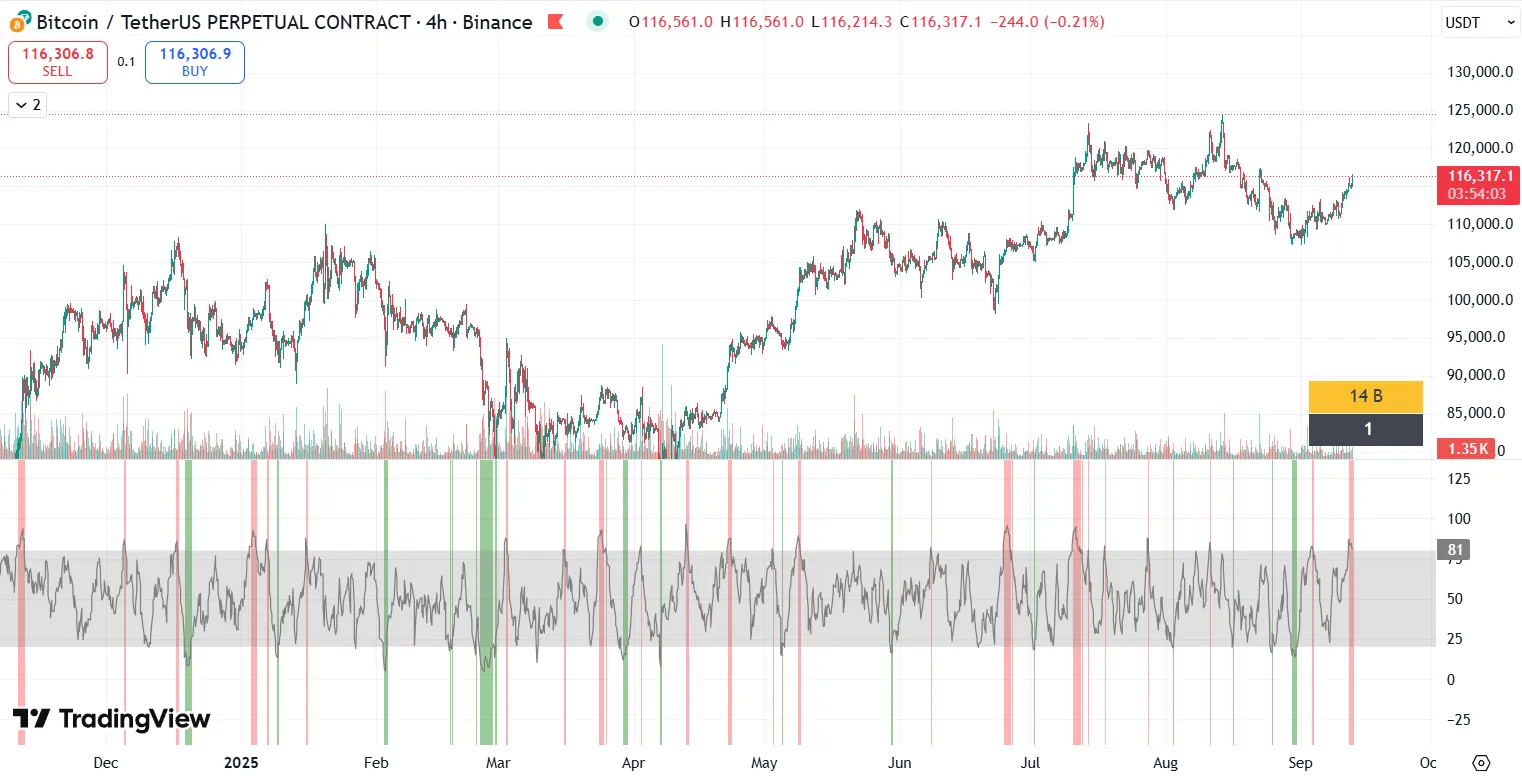
MFI Indicator in Cryptocurrency Trading
The cryptocurrency market is characterized by high volatility, unstable liquidity, and significant influence from large players, so using classical technical analysis tools here requires adaptation. In this context, the Money Flow Index MFI has become one of the most sought-after indicators among crypto traders. Its value here lies in the fact that it takes into account not only price dynamics but also trading volumes, and in the cryptocurrency market, volumes often signal hidden capital movements.
The feature of MFI in crypto trading is that it allows identifying accumulation and distribution phases. For example, when the price on the chart may appear “calm” or moving sideways, the Money Flow Index can show growth, signaling that large investors are quietly entering the market. Such a situation often precedes a strong bullish impulse. The reverse process occurs during distribution. For example, the indicator begins to decline, although the price is still at peaks. This behavior means that “whales” are gradually taking profits, while retail traders continue buying at highs.
Another important feature of using the Money Flow Index indicator in cryptocurrency trading is analyzing overbought and oversold zones under conditions of sharp volatility. Unlike traditional markets, where the index being in extreme zones (below 20 or above 80) more often signals an upcoming reversal, in crypto an asset can stay there much longer. However, it is the speed of exit from these zones that often becomes the main signal. For example, if after a long stay below 20, MFI sharply rises above 30, this may mean that the bearish phase is over and the market is ready for growth.
Crypto traders also use MFI to confirm signals from other indicators. If RSI shows overbought conditions but MFI is neutral, the signal is considered weak. If both tools coincide, the probability of a reversal becomes significantly higher.
Another important application of the index is working with technical analysis patterns through integration into a crypto bot. When you register on our platform, you receive a $5 bonus and the opportunity to use it to test the MFI indicator in combination with a bot. When a bullish or bearish flag pattern forms on the chart, the Money Flow Index helps understand whether this pattern is confirmed by the presence of liquidity. If when the flag breaks upward, MFI also rises, the buy signal becomes more reliable. If the indicator does not support the movement, there is a risk of a false breakout.
For long-term investors, Money Flow Index values in trading also have their place in analysis. On daily and weekly charts, MFI helps track global market cycles: accumulation periods before bullish cycles and distribution before bearish phases. Combined with fundamental factors and market sentiment analysis, it allows making more balanced investment decisions.
How to Use MFI in Trading Strategies
The Money Flow Index (MFI) can be applied in various scenarios, from finding entry and exit moments to confirming trend strength. One of the most common methods is analyzing overbought and oversold zones. When the Money Flow Index value drops below 20, it indicates asset oversold conditions and possible rapid growth, while values above 80 indicate overbought conditions and risk of correction. However, in the crypto market, such signals need to be interpreted carefully, as high volatility can keep an asset in extreme zones for quite a long time. This is why many traders wait for confirmation in the form of candlestick patterns or breakouts of support and resistance levels.
Another way to use the Money Flow Index is related to divergences (divergence between price dynamics and technical indicators). If the price updates a high, but MFI shows a decline, this indicates weakening buying power and the probability of a reversal. A similar situation occurs when the price falls, but MFI forms a rising dynamic — this is already a signal for a possible bounce. This approach is most useful in crypto trading, where large players are present in the market, and their activity can be noticed precisely through analyzing the ratio of price and volume.
An important element of applying the Money Flow Index is filtering RSI signals. Since MFI takes volumes into account, its signals are often considered higher quality. For example, if RSI shows overbought conditions, but MFI remains in a neutral zone, many traders ignore this signal, understanding that there is no real capital inflow into the market. At the same time, it cannot be said unequivocally that MFI is better than RSI, but it is precisely due to taking volume into account that it is considered more informative and often acts as a reliable filter.
MFI is also used to assess the strength of trend movements. When the price breaks through an important resistance level and the indicator shows growth, this confirms the truth of the breakout and buyer activity. If the breakout is not accompanied by an increase in MFI, there is a high probability of a false signal. Moreover, analyzing the dynamics of the Money Flow Index allows identifying accumulation and distribution phases. If the indicator steadily rises from a zone of low values, this may mean that large investors are gradually buying up the asset, preparing the ground for a strong movement.
Finally, it is important to consider MFI’s work on different timeframes. In short-term trading, it helps find quick entry and exit points even during volatile movements. On daily and weekly charts, the indicator allows determining global overbought and oversold zones. Such zones are valuable for investors who focus on the long term and look at the market picture more globally. To summarize, the Money Flow Index is universal and can be applied both for scalping and positional strategies.
Advantages and Disadvantages of the Money Flow Index
Advantages:
- volume consideration in calculations
- high signal accuracy
- versatility across different timeframes
Disadvantages:
- possible false signals with low liquidity
- need to combine with other indicators
FAQ
What is a good MFI value?
The optimal value is considered to be the range of 40–60, when the market is in equilibrium.
Is MFI better than RSI?
Not always better, but more informative. RSI analyzes only price, while MFI adds volumes, making it more accurate.
What is the difference between high and low MFI?
High MFI (above 80) indicates strong capital inflow and probable overbought conditions, low (below 20) — capital outflow and oversold conditions.
Can Money Flow Index be used separately?
Technically yes, but in practice it is more reliable in combination with other cryptocurrency trading indicators.
Is MFI suitable for long-term strategies?
Yes, but in the long term it is less sensitive. Most often, the Money Flow Index is used in short-term and medium-term trading.