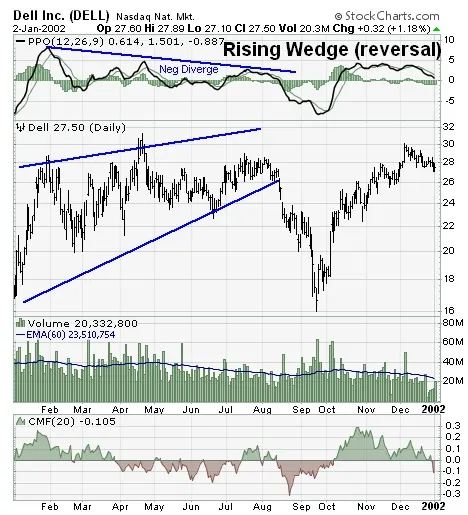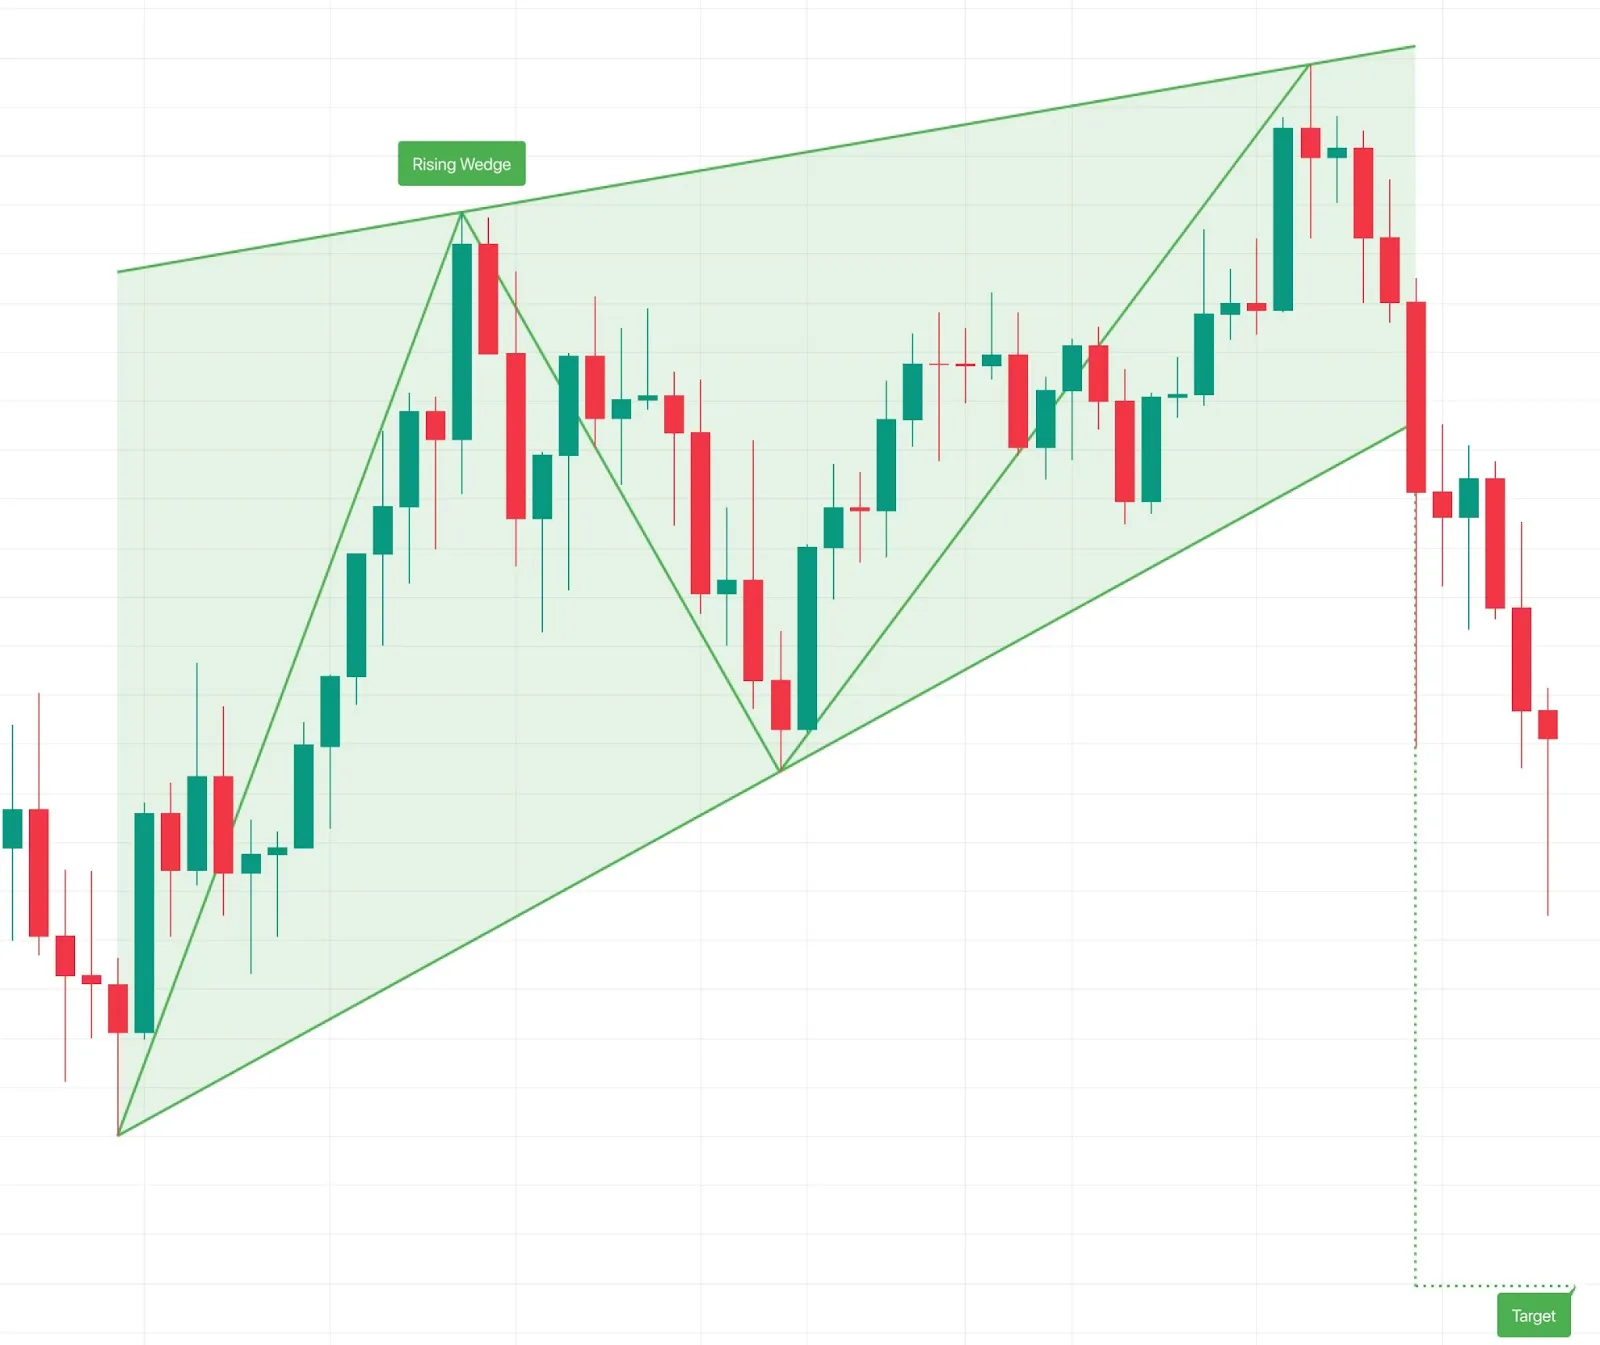
Part 2. How to use a rising wedge in a strategy
Continuing the topic from the first part, where we analyzed what the rising wedge pattern is, how it is formed and what information it can carry to a trader, in this part we will focus on the practical application of the pattern. We will analyze strategies for manual and automated trading, learn which indicators are best to combine the wedge pattern with, as well as analyze common mistakes that should be avoided.
Strategies for algo-trading
For cryptocurrency algo-trading, it is important not only to recognize technical analysis figures, but also to react to them in an automated way. The rising wedge pattern is particularly well suited for use in crypto bots. In the algorithm, you can set the conditions under which the bot will fix the breakdown of the rising wedge downward and instantly open a short position. Support and resistance levels, moving averages, and signals from other indicators are added to avoid false breakout.
The wedge pattern and its logic are especially effective when the price shows a narrowing range of growth for several candles and the volumes are falling - this is a clear bearish signal for automated strategies. In such cases, the bot can analyze the chart and additionally check for confirmation of the signal by other means.
Veles bot allows you to implement strategies where the wedge is used as the main filter for opening positions, or as a signal to close previously opened long trades. It can also be integrated into candlestick analysis on the cryptocurrency exchange, which enhances the reliability of decision making.
Rising wedge in combination with other indicators
Of course, no indicator can give 100% objective information about market movements. That is why the rising wedge should be used in combination with other technical analysis indicators.
RSI and volumes - signal confirmation
Using the RSI indicator helps to understand whether the asset is really overbought, which is characteristic for the end of the ascending wedge formation. If there is a decrease in volumes, it strengthens the probability of a breakdown.
How RSI is calculated and what the RSI indicator shows is important knowledge for building a strategy. Typical scenario: price is approaching the upper boundary of the wedge on the chart, RSI is above 70, and volumes are falling. This is a signal for a possible reversal - in algo-trading you can set triggers for these conditions.
Using MACD and moving averages
Trend indicators such as MACD and moving averages help to identify weakening bullish momentum within an upward trading wedge. A divergence of MACD lines and a downward moving average crossover can serve as secondary confirmation, especially if it occurs at the same time as a pattern breakout.
Combination with Fibonacci levels
Fibonacci levels are used to find potential support points after the breakdown of an ascending wedge. For example, if the price breaks the lower boundary of the pattern, we can expect the first stop at 0.382 or 0.5, where the bot can partially take profits. In algo-trading this is conveniently realized through crypto bots, in them you can set targets for levels in advance.
Examples of mistakes and incorrect application
Despite its effectiveness, the rising wedge figure requires a competent approach to recognition and application. Mistakes in the interpretation of this technical analysis figure can lead to false signals and losing trades. Below we will analyze in detail the typical miscalculations made by both beginners and more experienced traders, including those who use crypto bots in cryptocurrency algotrading.
The first and perhaps the most common mistake is misidentifying a figure. Many traders mistake any tapering rising range for a wedge pattern, ignoring important details. In a rising wedge, both support and resistance lines should tend to converge and point upward. If at least one of the lines is strictly horizontal, it may already be a triangle or channel rather than a wedge on the chart. It is also important to take into account the trend in which the figure is formed - a rising wedge on a downtrend can act as a continuation figure, not a reversal, as in the classic case.
The second mistake is ignoring volumes and confirming indicators. Without analyzing the volumes, it is easy to mistake a false breakout for a real one. If there is a breakout of the lower boundary of the rising wedge, but the volumes remain low, the signal may be unreliable. To filter out such situations, it is advisable to use indicators like RSI, MACD and support and resistance levels that add confidence in the price action. As we wrote in the previous article, what the RSI indicator shows and how to trade on RSI are important knowledge to improve the accuracy of entries.
The third mistake is entering a trade too late. Often traders or algorithms, especially when weakly tuned, react with a delay to the breakout of a rising wedge. This can lead to the fact that the deal will be opened after the main movement, which means that the profit potential decreases and the risks increase. This is especially critical when trading on leveraged futures, where even a small pullback can lead to position liquidation. In the case of algotrading, it is important that the cryptocurrency bot is programmed to respond in a timely manner, taking into account all the conditions to confirm the signal.
Lack of risk management is also common. Even if the chart analysis showed the formation of a good bearish pattern, the possibility of error cannot be ruled out. Without stop-losses, especially when trading on patterns like a rising wedge, a trader risks getting into a losing position at any deviation from the expected scenario.
Finally, one should not forget about over-reliance on a single pattern. Pivot patterns such as the bearish rising wedge pattern should not be used in isolation. A solid strategy is always a combination of factors, including candlestick analysis on the cryptocurrency exchange, working with volumes, trendlines, indicators and levels. This is especially critical in automation, where a bot for cryptocurrency trading must take into account a complex set of conditions.
FAQ
1. What is a rising wedge pattern and what is its essence?
A rising wedge pattern is a reversal pattern in which the price moves in a narrowing upward range. It usually signals a weakening bullish trend and an impending decline.
2. How does a wedge in trading work and what signals does it give?
A wedge is formed by slowing growth, with highs and lows becoming closer. A bearish signal occurs when the lower boundary is broken.
3. What is the difference between a rising wedge and a triangle or channel?
In a wedge figure both borders are inclined to one side and converge. In a triangle, one side may be horizontal. A channel is a parallel structure.
4. Can a rising wedge be used in cryptocurrencies?
Yes, especially on the Veles platform, where you can set rules to analyze and automatically enter when a rising wedge is broken. This is a reliable approach in high volatility environments.
5. How to avoid false signals?
Combine the wedge pattern with indicators like RSI, MACD, analyze volumes and levels. Check for false breakout, confirm signals by several parameters.

