Stochastic indicator: description and application
Stochastic is one of the most popular technical indicators used in crypto trading. Due to its versatility and ability to indicate the moments of trend reversal, the indicator is widely used in both manual trading and cryptocurrency algo-trading.
What is a stochastic oscillator
A stochastic oscillator is a technical indicator used to assess the strength and direction of the current price momentum. It helps to determine whether a cryptocurrency is in an overbought or oversold condition and is used as the basis of many strategies, especially in a sideways or weak trend. The indicator is based on the assumption that in an uptrend, prices tend to close closer to the highs, and in a downtrend - to the lows. Stochastic calculation and its signals are based on this principle.
Who invented it and why it is used
Stochastic was developed by George Lane in the 1950s. His main idea was not just to follow the price movement, but to analyze the speed and direction of the impulse. Lane believed that it is the momentum that changes before the price itself, so this indicator can predict potential trend reversals before they occur on the chart.
The Stochastic indicator allows traders not only to follow the trend, but also to determine the optimal entry and exit points for trades. Due to its ease of use and high visibility, it is especially popular with novice traders who are just learning how to use Stochastic. At the same time, experienced market participants use it as part of complex strategies, combining it with other indicators or analyzing the behavior of Stochastic lines in certain areas of the chart.
How it is calculated (K and D percentages)
The stochastic oscillator is based on two lines: %K and %D. The first of them, the %K line, is calculated as the ratio of the difference between the current closing price and the minimum price for the selected period to the range between the maximum and minimum for the same period. The obtained value is multiplied by 100 and expressed as a percentage. This is the main line reflecting the current strength of the price momentum. Simply put, if the closing price is closer to the high of the range, the %K value will be high; if it is closer to the low, it will be low. This allows you to visually assess how close the asset is to the edge of its range.
The second line, %D, is a moving average of %K, usually over the last three periods. This smoothing removes market noise and provides more stable signals. The intersections of %K and %D are the basis for stochastic signals: when the fast %K line crosses the slow %D line from bottom to top, it can indicate a potential upward move, while a cross from top to bottom signals a potential downward move. These are the points that traders often use as part of Stochastic trading strategies, whether it is scalping or a slow Stochastic strategy.
How to interpret Stochastics
In order for the Stochastic indicator to be of real use in crypto trading, it is important not only to understand how it is calculated, but also to interpret it competently. A trader must learn to identify important zones and track the behavior of stochastic lines to find profitable entry and exit points for trades. With proper setup and analysis, the Stochastic oscillator can become one of the most accurate tools in the trader’s arsenal, especially when used in the algotrading of cryptocurrencies and bots for trading on the exchange.
Overbought and oversold zones
The main way to interpret the stochastic is to analyze its position relative to fixed levels - 80 and 20. When the value of %K or %D rises above the 80 level, it is said to be an overbought zone. This means that the price of the cryptocurrency is trading closer to the upper boundary of its range, and a correction or downward reversal may occur. However, being in the overbought zone does not necessarily indicate an imminent fall - the trend may continue. Nevertheless, it is a signal for increased attention and possible profit taking, especially when working with Stochastic strategies.
When the values of %K and %D fall below the level of 20, the oversold zone occurs. This signals that the asset is trading closer to the lower boundary of the range, and an upward reversal is possible. Such moments are especially valuable when using Stochastics in scalping, when a quick reaction to short fluctuations is important.
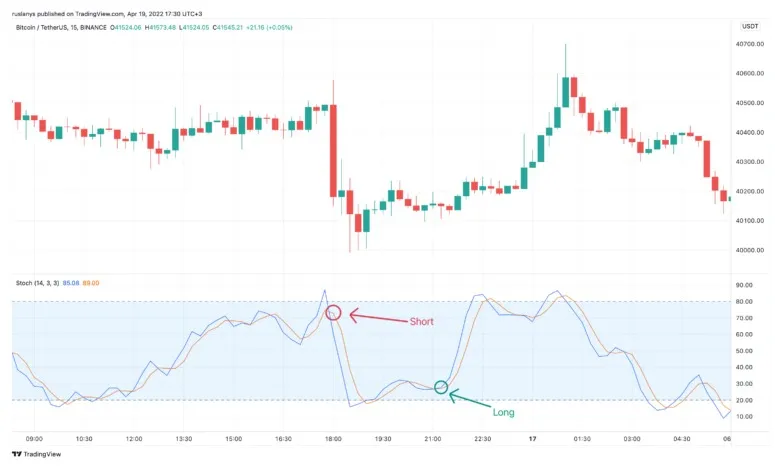
Signals for entry and exit
The most common Stochastic signals occur when the %K and %D lines cross. When %K crosses %D from bottom to top in the oversold zone (below 20), it is considered a buy signal. It indicates the possible beginning of an upward movement and is used as an entry point. In the opposite situation, when %K crosses %D from top to bottom in an overbought zone (above 80), it is a sell signal - a sign of a possible start of a correction or downward reversal.
However, such signals are not always equally effective. In flat conditions (sideways price movement) they give the most reliable results. At the same time, in a trending market, especially with a strong bullish impulse, Stochastic may constantly show overbought, but the price will continue to grow. In such cases, it is better to use signal filtering, for example, open trades only in the direction of the main trend or confirm crossovers with other indicators.
Advanced traders also analyze stochastic divergences. These are situations when the price updates the maximum, but the stochastic does not, or vice versa. Such divergences often foreshadow a change in trend direction. You can also use the strategy of two stochastics, in which one indicator with a long period determines the general direction, and the second, fast - gives signals for entry. This methodology is well realized in bots for trading on the stock exchange.
Examples of using stochastics in cryptocurrency
How stochastic works in practice is especially noticeable when it is combined with other tools. For example, stochastics and RSI or a combination with MACD gives more accurate signals, increasing the efficiency of entries and exits.
Combinations with other indicators (RSI, MACD)
Stochastics are used in multi-indicator systems. When stochastic confirms a signal from RSI or MACD, the probability of a profitable trade increases. Such stochastic secrets and strategies are often used in professional strategies for algo-trading cryptocurrencies.
How to integrate stochastic into a trading bot
Integrating the stochastic indicator into automated trading systems is an important step in the development of cryptocurrency algotrading. To use this oscillator in algorithmic trading, you need not only to understand its behavior on the chart, but also to competently implement the technical part: processing quotes, calculating %K and %D values, interpreting stochastic signals and executing trades through the API of the cryptocurrency exchange. A properly configured bot for trading on the exchange is able to trade faster and more accurately than a human.
Working through the API of crypto exchanges
The first step is connecting the trading bot to the exchange via API. Most crypto exchanges, such as Binance, Bybit, OKX, HTX, Gate. io and BingX, provide open interfaces that allow you to request market data, place orders, manage your balance, and monitor positions. Through these APIs, the bot receives real-time quotes, based on which the stochastic lines are calculated.
The algorithm starts with obtaining historical data for the selected timeframe - it can be 1 minute, 5 minutes, an hour or a day depending on the chosen stochastic strategy. Next, the %K is calculated: the maximum and minimum for a given period (for example, 14 candles) are determined, then the current price position relative to this range is calculated. The %K is then smoothed to %D, usually using a simple moving average. These calculations are performed continuously - as soon as a new candle closes, the indicator is updated.
Based on the calculations, the crypto bot makes decisions: if, for example, %K crosses %D from bottom to top in the oversold zone, the algorithm interprets this as a buy signal. In the opposite situation - as a sell signal. This is how the stochastic trading strategy is realized. To avoid false entries, it is often used in combination with other filters, such as RSI, MACD or trend indicators. In addition, you can apply the strategy - two stochastics, when signals are confirmed by two oscillators with different parameters: fast and slow.
Examples of implementations in Veles
The Veles platform implements a modular approach to creating trading strategies. In Veles users can build their strategy from ready-made blocks without deep programming knowledge. One of these blocks is a stochastic, available in the graphical interface of the strategy builder.
In Veles, you can set the parameters of the indicator manually: choose the length of the period, the type of moving average for %D and the overbought/oversold levels. Then you can set logic rules: for example, “open a long position if %K crosses %D from bottom to top with a value below 20”. This logic is linked to actions - the bot places a market or limit order via the API of the connected exchange. It is also possible to combine several conditions: for example, to open a trade only if the stochastic divergence is confirmed by the RSI signal.
Thus, integration of the Stochastic indicator into a trading bot is not just a technical process, but a full-fledged construction of trading logic. And such solutions as Veles allow you to speed up the path from an idea to a ready strategy.
FAQ
1. How to use stochastic indicator in crypto trading?
To effectively use the stochastic indicator, you need to observe the intersection of the %K and %D lines, as well as consider the overbought (above 80) and oversold (below 20) zones. By combining the signals with other indicators, you increase the accuracy of trades.
2. How to properly set up Stochastic for trading?
The most popular Stochastic settings are 14-3-3 or 9-3-3 periods. The choice depends on the strategy: for stochastic scalping, fast settings are suitable, and for long-term trading - the slow stochastic strategy. Selection of parameters requires testing on historical data.
3. Is stochastic suitable for trend strategies?
In its pure form, the stochastic oscillator can give false signals in a trending market. However, if it is used in combination with trend indicators (for example, MA or MACD), it can become an excellent filter. Hence the question - do I need stochastics in trend strategies? The answer is: it is necessary, but with caution.
4. What is a two stochastics strategy and why do I need it?
The two stochastics strategy uses two oscillators with different parameters: one slow oscillator determines the general trend, and the second fast oscillator determines entry signals. This increases accuracy and reduces the number of false signals.
5. Can stochastic be built into a trading bot?
Yes, the stochastic indicator can be easily integrated into a stock trading bot via the API of cryptocurrency exchanges. In such systems, calculation accuracy is especially important, so an accurate stochastic indicator implemented through a technical analysis library is used. There are examples in solutions such as Veles, where the stochastic works in automatic mode.