
TOP-3 effective indicators in trading
For those unfamiliar with the cryptocurrency market, price charts can be unpredictable. Adherents of fundamental analysis often claim that technical analysis is unable to explain the causes of price fluctuations or predict their direction. However, the principle of technical analysis is based on the idea that price changes are related to the psychology of investors. In similar situations market participants behave in the same way, and the balance of supply and demand is formed under the influence of human instincts - both greed and fear.
What matters here is not the individual activity of traders, but the “crowd psychology” that drives asset prices. This understanding of the processes becomes the key to predicting market movements.
The fundamental principle of technical analysis states that “price reflects everything”, including expectations of future changes. Therefore, to predict asset dynamics, it is sufficient to use mathematical algorithms to analyze price data.
Among the many indicators, the most popular ones stand out, the effectiveness of which is confirmed by practice. Each of them can bring profit, provided that the basic principles of risk and capital management are observed.
RSI (Relative strength index) indicator
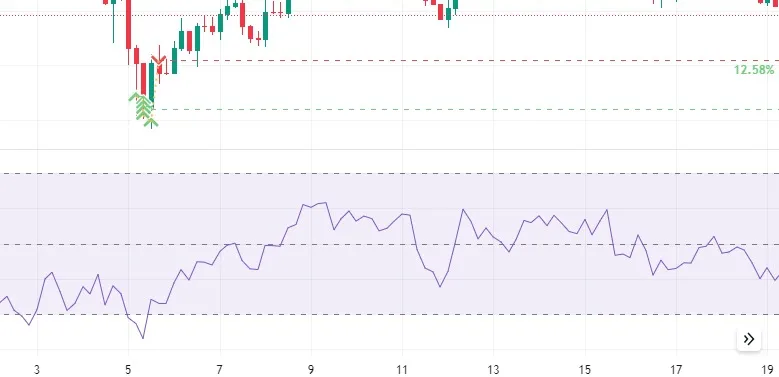
Generally, when the RSI indicator crosses the 30 mark on an RSI chart, it is a bullish sign, and when it crosses the 70 mark, it is a bearish sign.
In other words, we can interpret that RSI values of 70 or above indicate that an asset is becoming overbought or overvalued, it may be ready for a trend reversal or corrective price pullback. An RSI reading of 30 or below indicates that the asset is becoming oversold or undervalued, which also indicates that a price reversal may be imminent.
Bollinger bands indicator
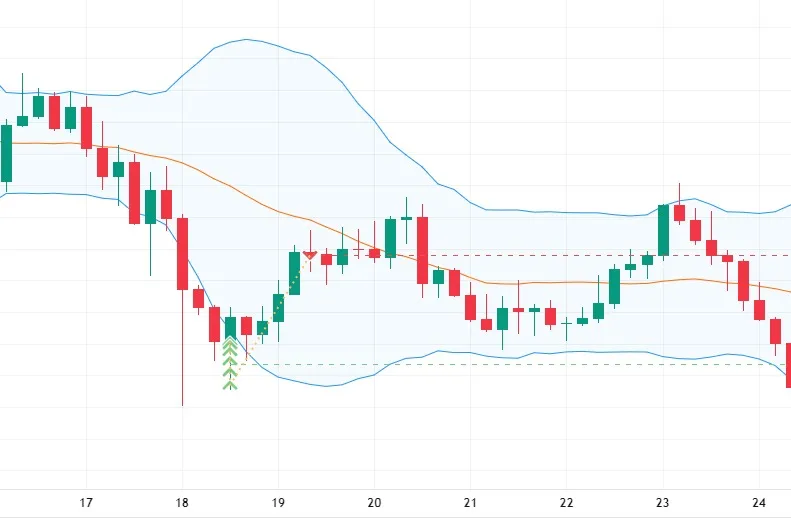
The tool tries to identify pivot points by measuring how far price can move away from the average center line - the 20-day SMA in this case - before triggering a return impulse back to the center line.
Bands also contract and expand in response to volatility, showing uncertainty in the market. When price moves at a normal pace, the bands narrow - indicating less volatility in the market, and when some important events occur, they widen - volatility increases.
Stochastic Oscillator (Stochastic Oscillator)
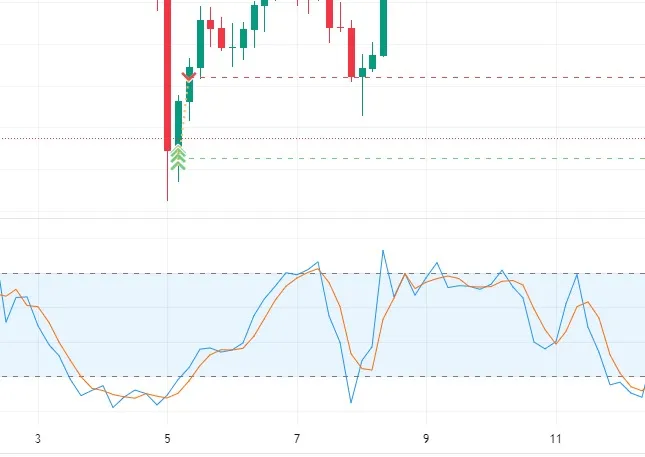
The indicator allows estimating the growth/decline of the asset price for a given period in percentage terms. Proximity to the boundaries (100% when rising and 0% when falling) indicates the development of a trend. As in RSI, it uses the concept of overbought/oversold zones, the exit from which is considered a strong signal of trend change. It also generates leading signals due to the intersection of the main and signal lines (the second one is the result of smoothing the first one with the help of the moving average).
Let’s try to put together a trading strategy, according to the LONG algorithm, based on these three indicators.
First of all, it is necessary to set our working timeframe (time interval). The choice of this timeframe plays an important role, as it directly affects the success of trading operations. When we change the timeframe, the chart shows information about trends of different orders. If we choose a short-term timeframe, we observe local trends that can change several times in a day. While long-term timeframes provide information about global trends, the formation of which can take days, months or even years.
In addition, as the timeframe increases, the expected profit also increases, while the risk level, on the contrary, decreases. We will try to develop a simple and effective strategy based on the 4-hour timeframe.
Using a comprehensive approach to creating a trading system, we clearly understand what each indicator in our strategy is responsible for, namely:
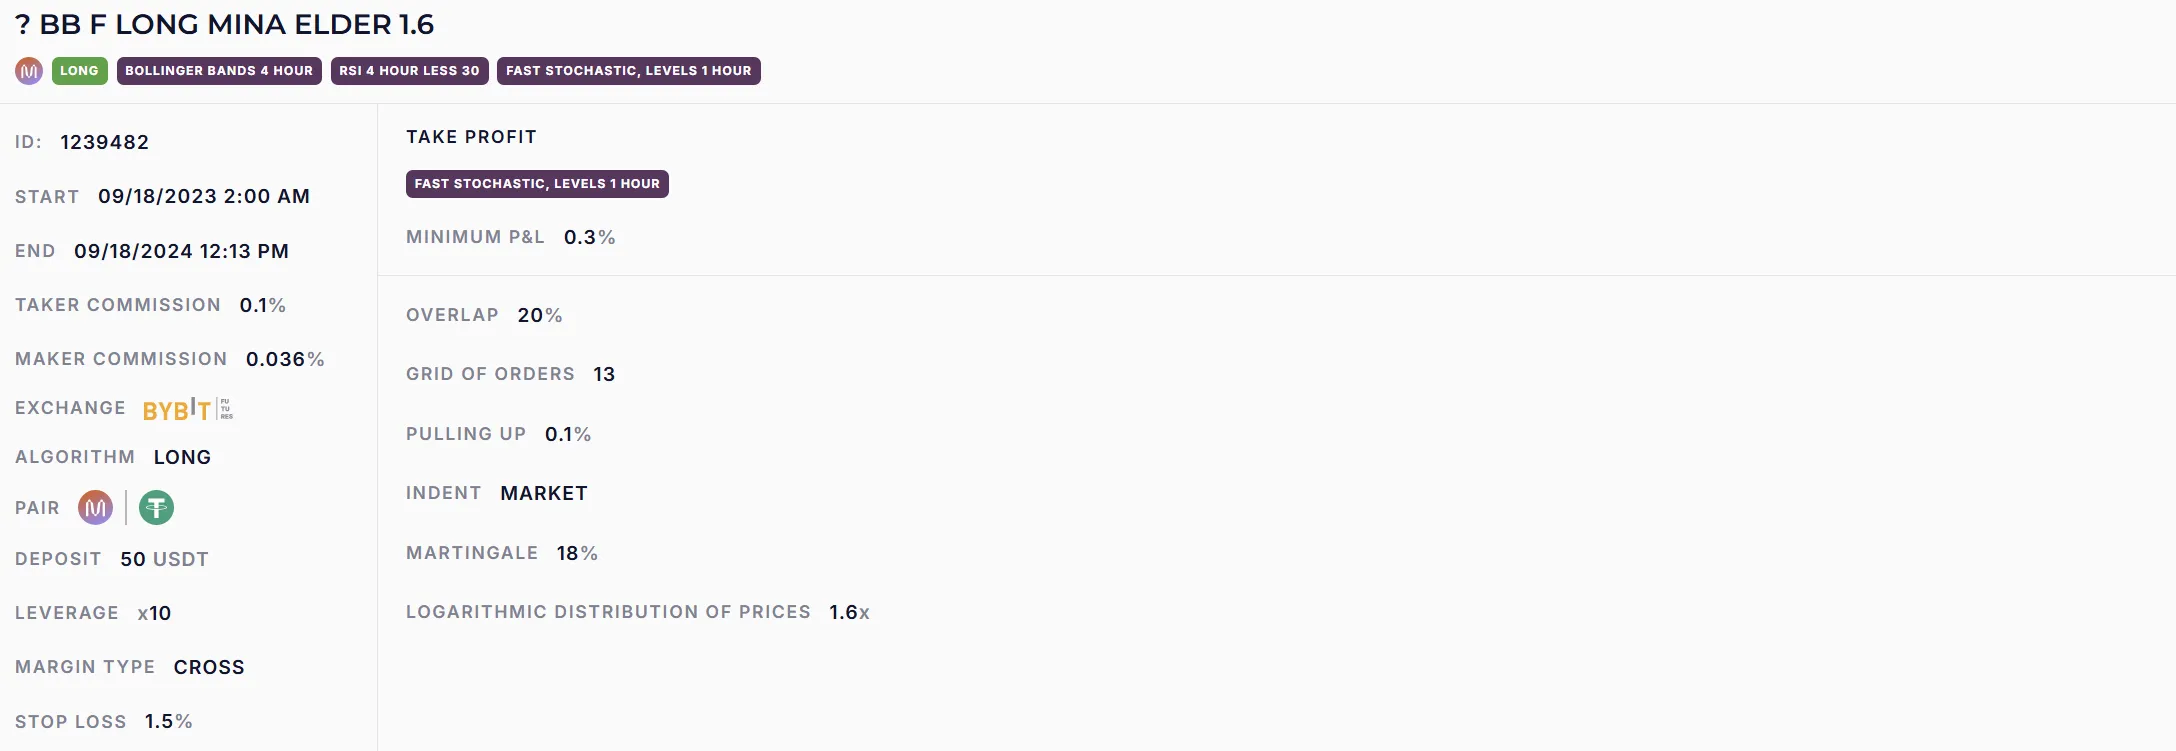
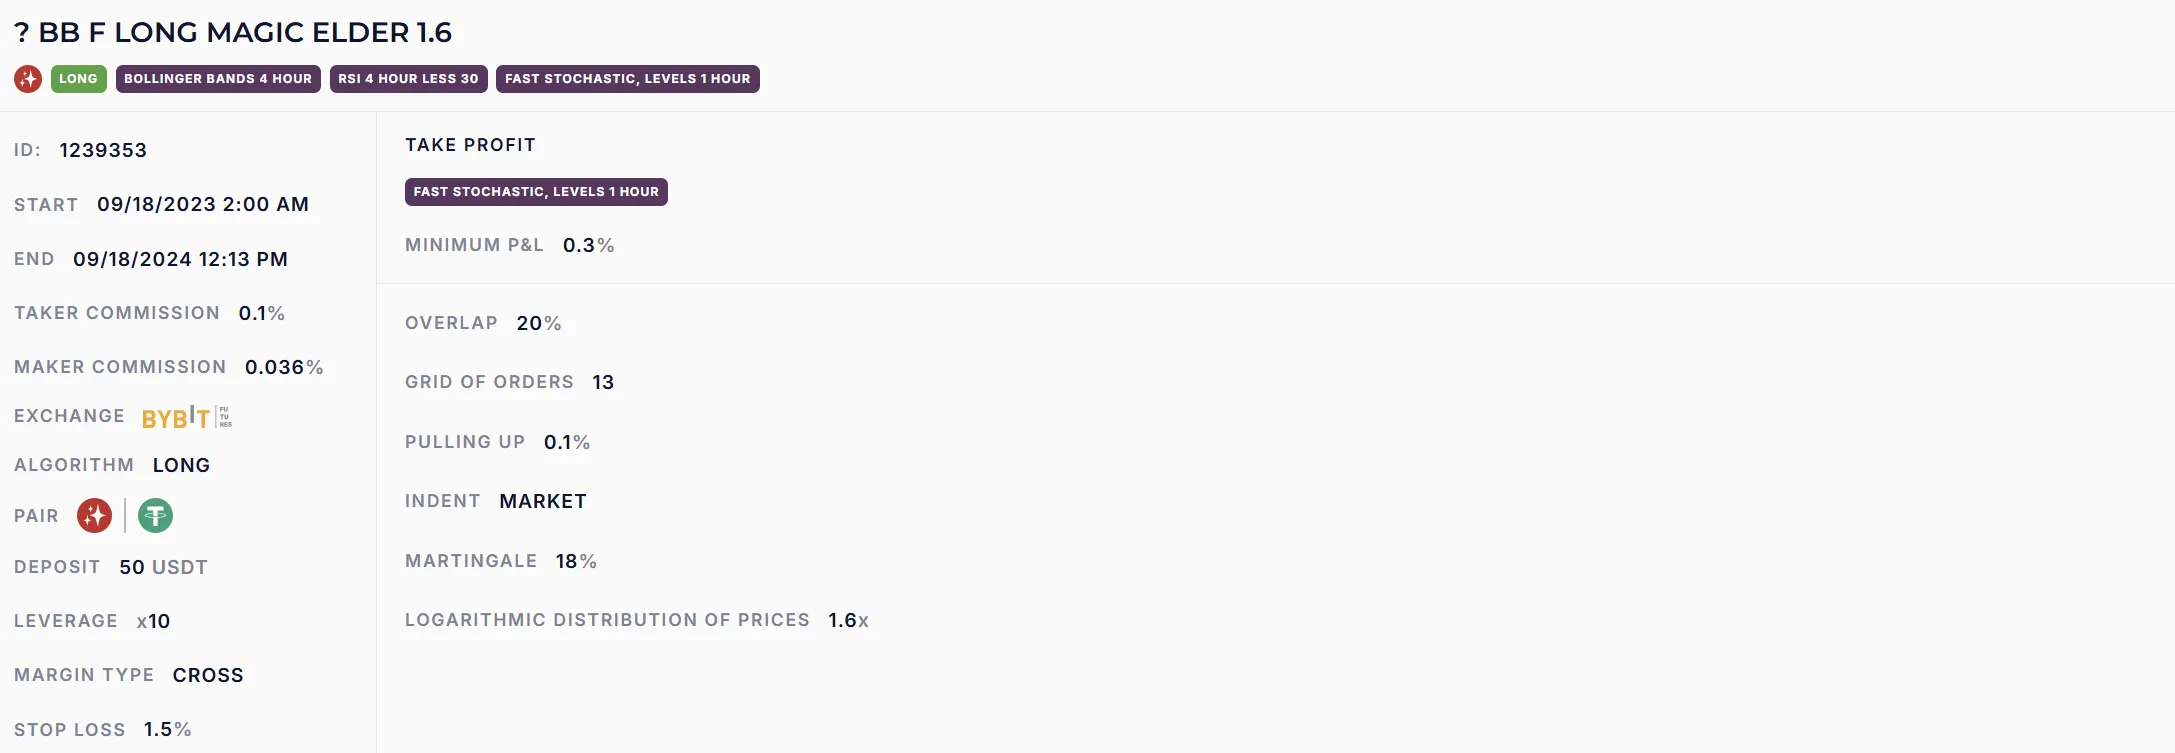
To determine the oversold zone (<30) we will set the RSI indicator.
To confirm the signal, we use the probability of price bounce from the channel boundary to the average value, according to the Bollinger Bands indicator.
For better filtering of signals for entry, on a lower timeframe, use the indicator “fast Stochastic - levels”. Let’s set this indicator to enter on the timeframe of 1 hour.
Taking into account that we have received 3 confirmations to open our position and the entry point is quite good, there is a possibility to “pull” the gained volume and close the position by the same indicator “fast Stochastic - levels”, for example (we will not complicate the strategy too much).
For the test of our trading strategy we allocated a deposit of 50$ for each asset. Observing the risk- and money management, we left the margin (free funds on the account) in the ratio of 1 to 2 (50$ - trading deposit, 100$ - support). To minimize risks, we use blocking by the number of bots, but about it - separately.
Let’s select several assets for our trading strategy (I have mentioned the selection of assets several times) and see what results the annual test showed us on historical data for this strategy:
BB F LONG LADYS ELDER 1.6 (79.8% p.a.)
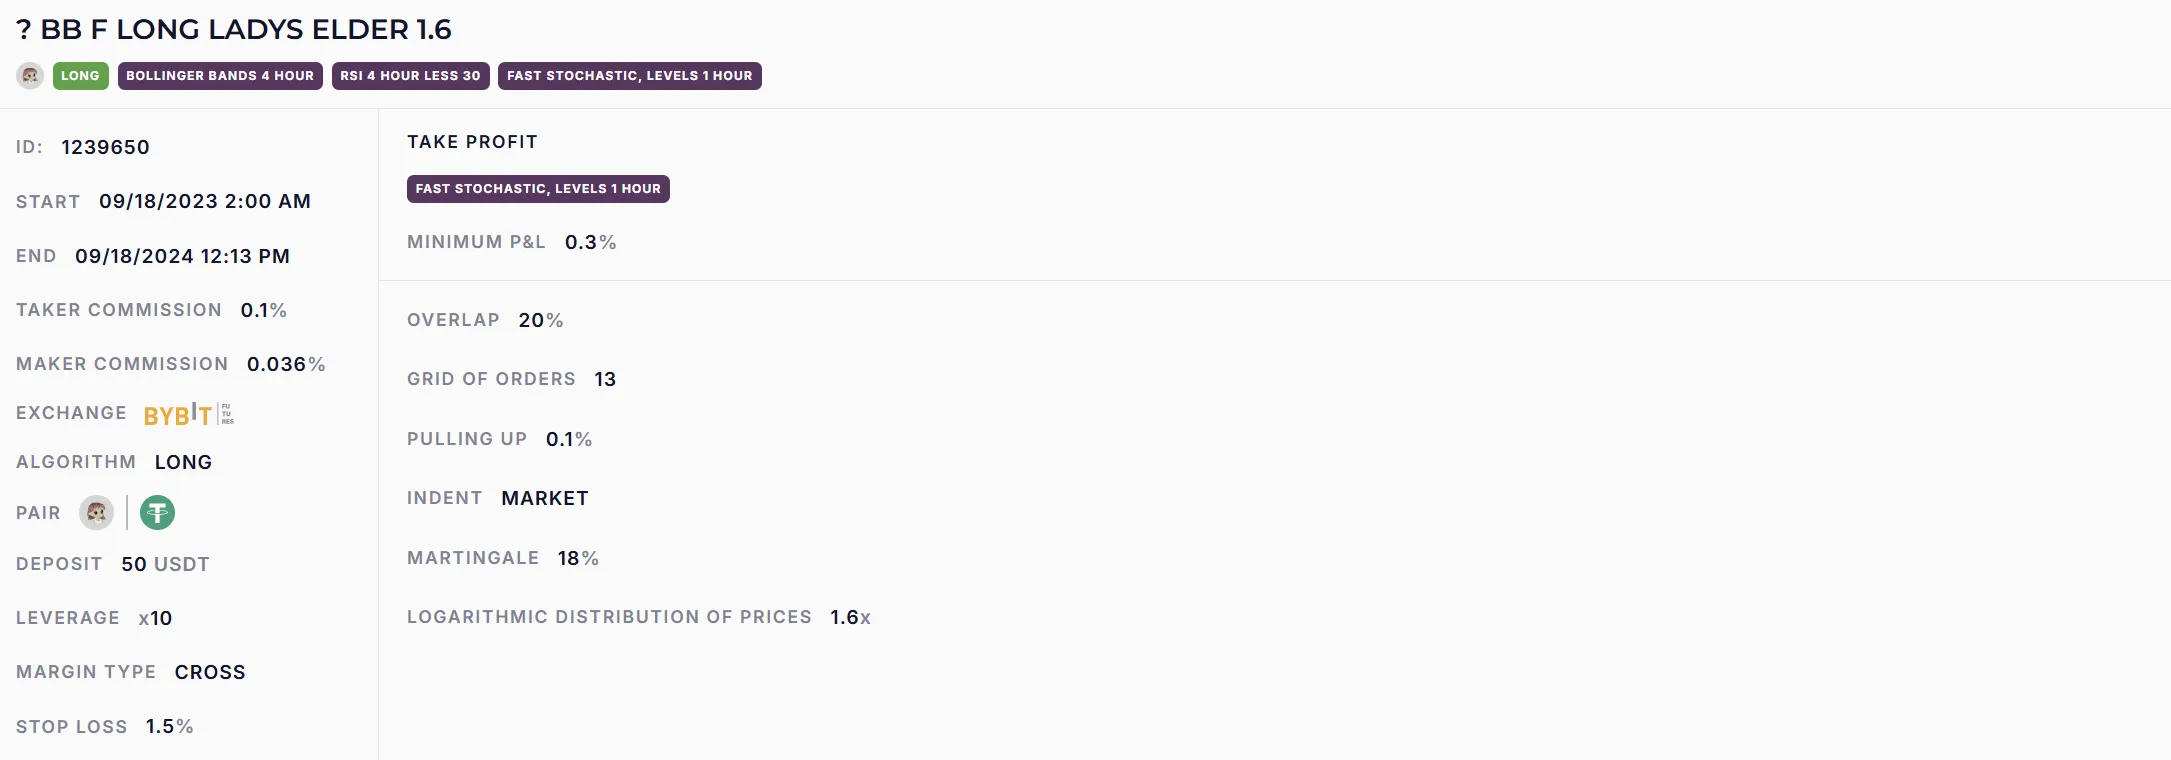
BB F LONG MINA ELDER 1.6 (86% p.a.)
BB F LONG MAGIC ELDER 1.6 (88% p.a.)
It should be noted that these trading indicators are quite universal and can be used to create other trading strategies. Try to “play” with timeframes or, for example, set additional indicators. Also, you can try to change the other settings of the strategy: “% overlap”, ‘% Martingale’ or the number of orders in the grid, taking as a basis these entry points.
A comprehensive approach to analyzing the situation will help you to calculate the potential of a position and what tools should be used to work out.
The Veles algorithmic trading platform bots are first of all a tool, and then a way to earn money. It is exactly the same trading, but without the emotional component of a person. Using the platform with the calculation of risk management and mani-management gives the opportunity for passive earnings at a distance.