The essence of the market is the reallocation of funds. This is where uptrends, downtrends and sideways trends come from.
After a strong market movement, when the majority of participants have closed their positions. After such movements, there is a period of calm in the market, or by another name, a sideways trend.
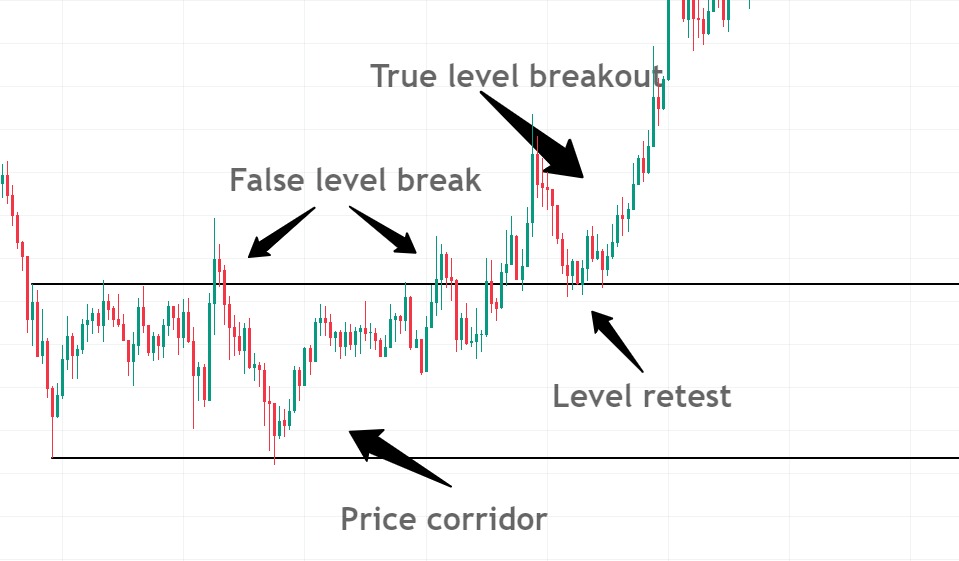
A sideways trend means that the price does not give a clear understanding of the movement. It forms a certain corridor in which it trades. This corridor is called a sideways trend.
The logical reasoning behind the sideways trend is that a large participant will gain a position. It is impossible to pour a large amount of money into the market, because it will cause an instant reaction of the price and a large position will not bring the planned profit. That is why it is taken in parts and in the price range.

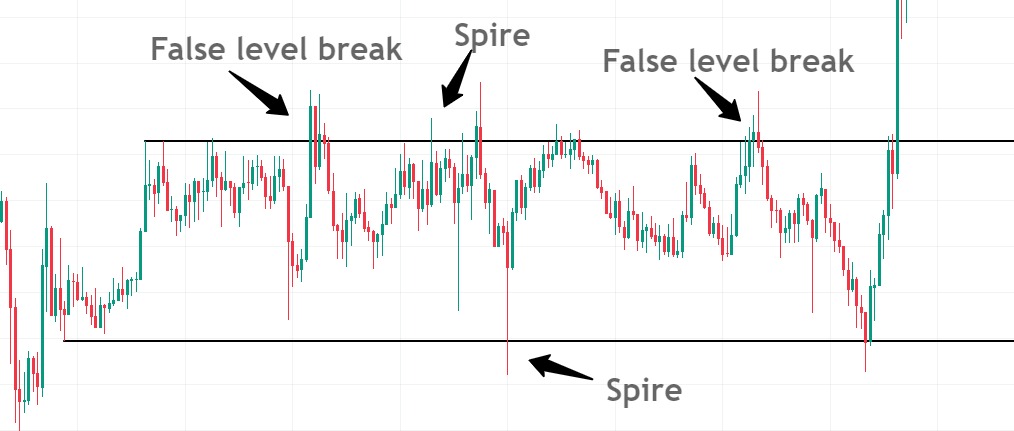
One more detail of the price corridor is the level’s shading. Its distinctive feature from a false breakdown is only in the level shadow. A false breakout is the closing of a candlestick behind the level and necessarily with a body.

For a situation where false breakdowns or price stalls occur, the key detail is the lack of trending movement in the bitcoin lead asset.
In addition to the basis, a false breakdown also has reasons:
- Lack of interest from buyers or sellers to break the level. The price corridor does not arouse the interest of retail traders, which is in the hands of a large participant. This gives him the opportunity to quietly build up his position and afterwards cause a strong trend movement.
- Too strong participant. Attempts by retail traders to break support and resistance fail due to the abnormally large position of a large participant. By actively trying to break through the levels, traders create huge liquidity for the position set, which makes the whale’s job easier.
- Two major players in the price corridor. In this case, a support level and a resistance level are formed by both major players at once. There is a monetary fight between the players, levels are rolled, and liquidity is collected. The finale of the situation is an impulsively strong trend movement.
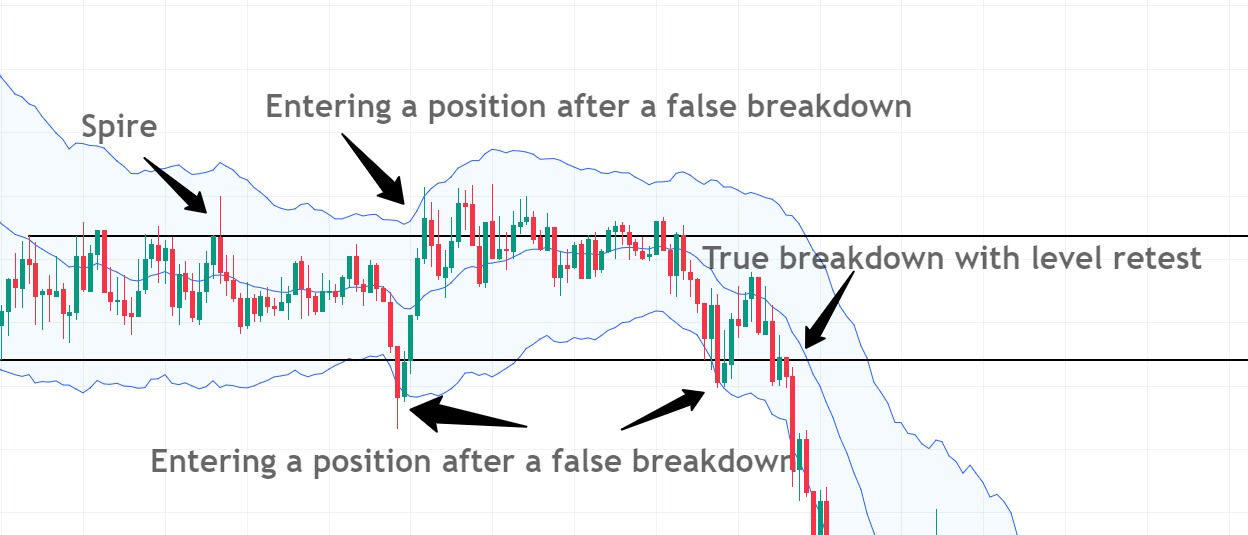
To trade false breakouts using the Veles platform, it is important to correctly assess the market situation and correctly identify the price corridor and its levels.


One of the ways to trade false breakouts with the help of trading bots Veles is the use of the tool “Keltner Channel”. The tool thanks to its formula determines the overbought and oversold zones. Under the mandatory condition that the trader has correctly identified the support and resistance levels, this tool will perfectly cope with trading false breakouts. It is important to use a timeframe from 15 minutes, otherwise the overall picture of the market will be distorted by strong fluctuations of small candles.
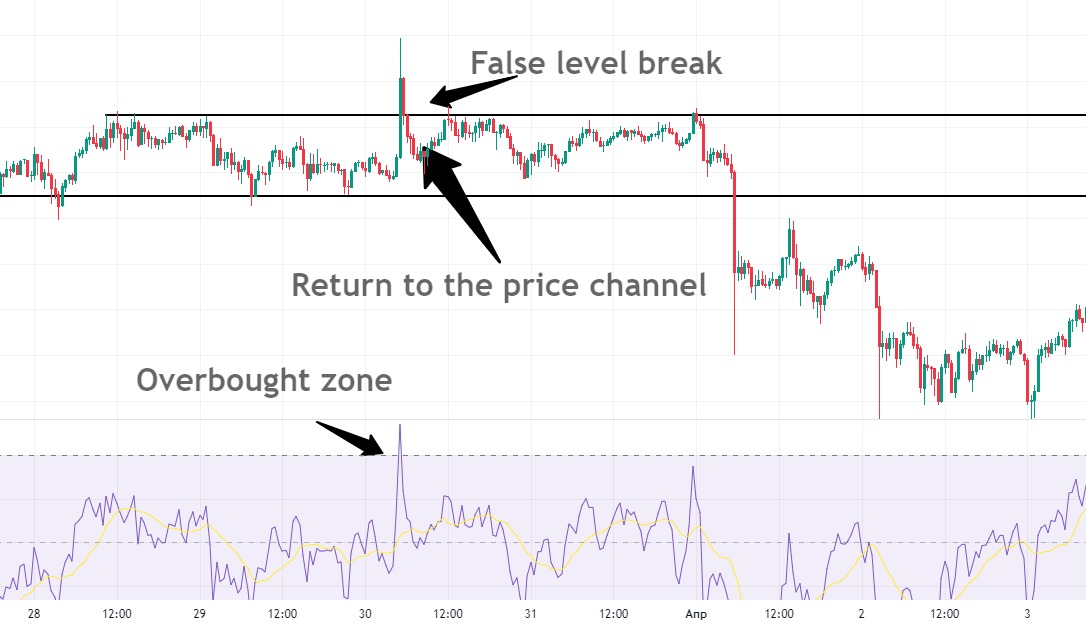
The next way will be trading, using almost the most popular indicator RSI.


With filter parameters greater than 75 and on a 30 minute timeframe, this tool will be able to identify true oversold zones, and the Veles bot will open a trade, in the direction of returning to the channel.
It is important to train your perspicacity in trading. Finding the right price channel is only half of the task. You also need to accurately determine the boundaries of this channel. Only experience and relentless practice of analysis will help with this.


 Date of publication:
  Time to read:
  Views: