
Williams Percent Range (%R) in cryptocurrency trading
Many people involved in trading do not know about the existence of such a useful tool as the Williams Percent Range. We will tell you more about it.
What is the Williams %R indicator
The Williams Percent Range is a classic oscillator (leading indicator) used to analyze price movements in financial markets, including cryptocurrency. The Williams Percent Range helps traders identify overbought and oversold zones, indicating possible market reversal points. In cryptocurrency trading, it has gained particular popularity due to its simplicity and efficiency.
History of creation
The indicator was developed by Larry Williams in the late 1970s. Williams sought to create a tool that would effectively catch short-term market fluctuations, which is especially relevant for trading on volatile assets such as cryptocurrencies. Today, the Williams indicator for cryptocurrency is widely used in technical analysis among both beginners and professionals.
The basic principles of work
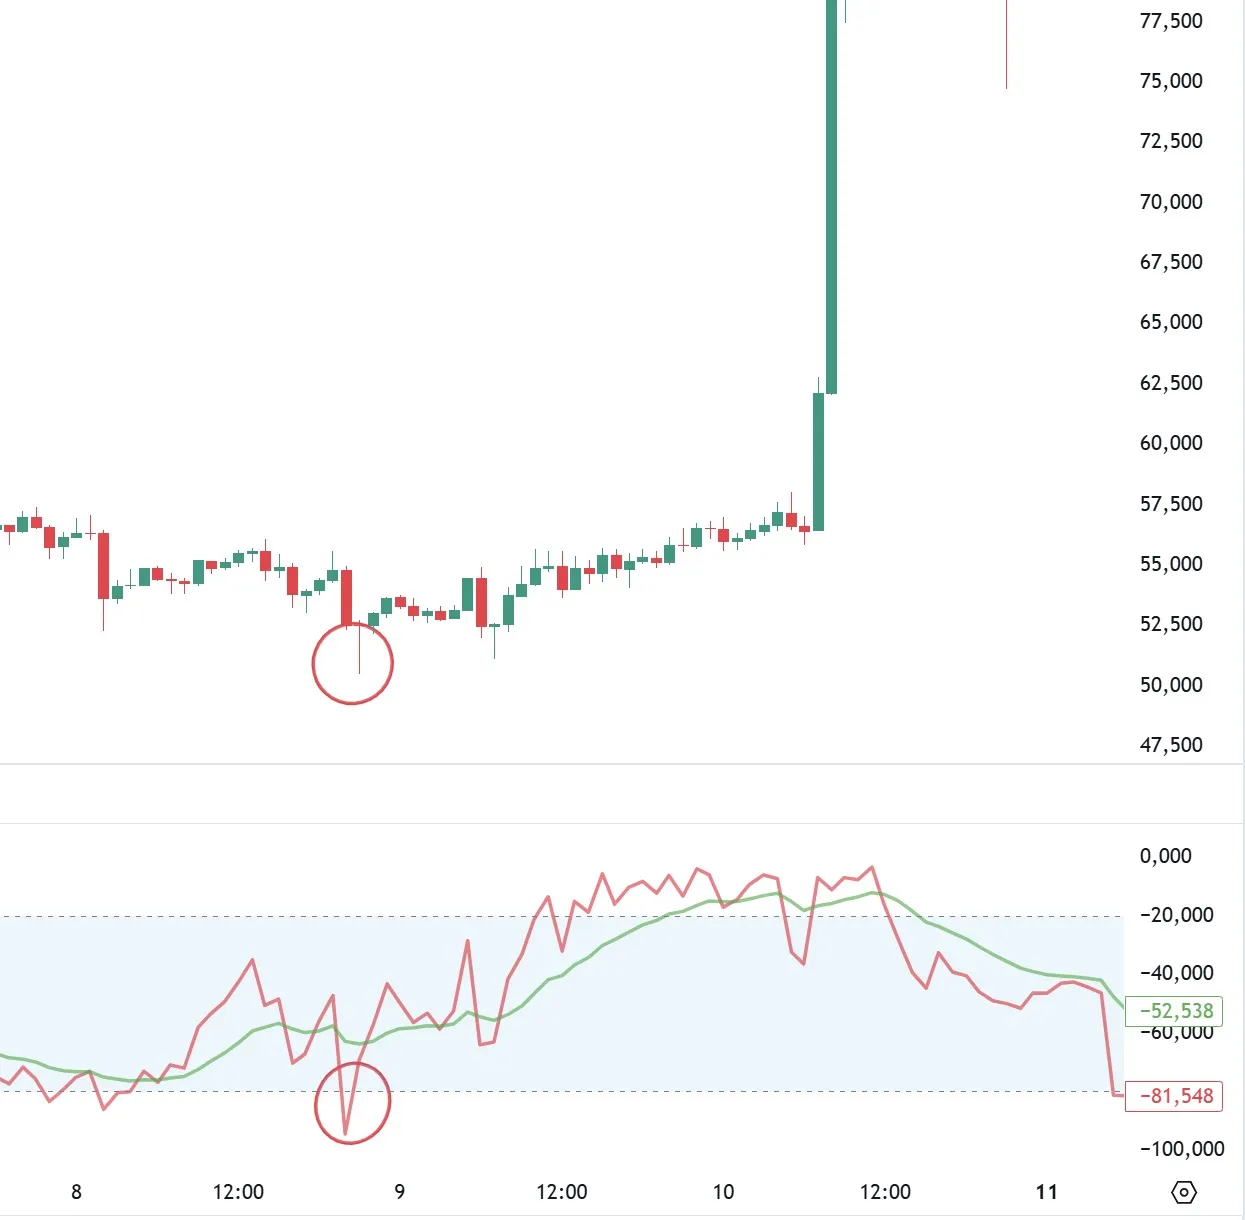
The Williams Percent Range or %R indicator is based on comparing the current closing price of a cryptocurrency with the range of prices for a certain period of time. Its main task is to determine how close the current price is to the maximum or minimum level for the selected interval. The closer the price is to the maximum, the more the market is in an overbought state. The closer to the minimum - the more obvious is the oversold condition. Understanding these states allows traders to make informed decisions in trading.
The work of the indicator is based on the assumption that in a rising trend the price tends to the upper boundary of the range, and in a falling trend - to the lower boundary. The value of %R in crypto varies from 0 to -100. A value near 0 indicates overbought, while a value near -100 indicates oversold. These boundaries serve as important benchmarks for finding entry and exit points for trades.
The indicator reacts to price changes faster than many other instruments. Therefore, it is considered to be a leading indicator in cryptocurrency trading. This gives traders the opportunity to prepare in advance for possible trend reversals, especially in highly volatile cryptocurrency markets.
Another important principle of operation is that buy and sell signals appear not just when overbought or oversold zones are reached, but at the moment when the price leaves these zones. That is, traders are guided by confirmed changes in market dynamics, which reduces the probability of false positives.
Thus, how the Williams %R works can be explained as follows: it shows how close the price is to the extremes of its price range over a selected period and signals potential reversal points. These characteristics make %R buy signals and %R sell signals useful elements of analysis both for manual trading and for use in cryptocurrency algo-trading and automated cryptocurrency trading with bots.
How Williams’ %R is calculated
A special formula is used to calculate the indicator’s performance.
Calculation formula
The indicator formula is as follows:
%R = (Highest price for the period - Closing price) / (Highest price for the period - Lowest price for the period) × (-100)
This formula allows you to determine the current strength of the trend and identify potential reversal points. Knowing how to read Williams’ %R helps traders to quickly assess the market situation.
How to interpret the values
The indicator values help to determine the market condition. If the %R is above - 20, the market is considered overbought. If it is below - 80, the market is considered oversold. These zones are important benchmarks for opening trades. Understanding the overbought and oversold %R levels is crucial for effective trading.
How to use Williams’ %R in cryptocurrency trading
Let’s analyze the main options for using this indicator in the conditions of the cryptocurrency market.
Buy and sell signals
Source: BCS Express
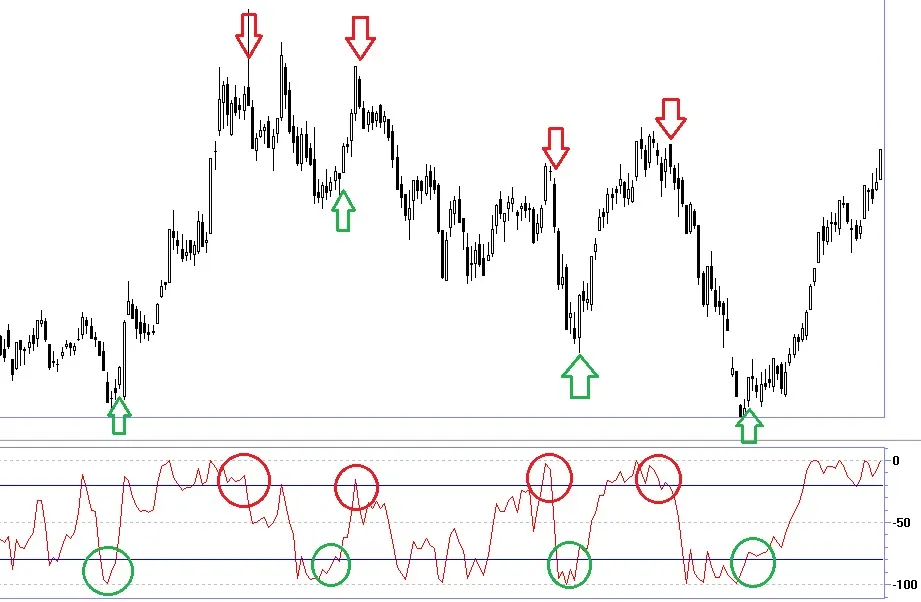
Williams’ %R indicator is widely used to generate trading signals in cryptocurrency trading. The main idea is to determine the moments when an asset enters an overbought or oversold state, as well as the subsequent exit from these zones.
%R buy signals occur when the indicator crosses the oversold zone from bottom to top. This means that the cryptocurrency has been trading at the bottom of the range for a long time and is starting to show signs of recovery. Traders take this moment as a signal to open a long position in the expectation of growth in value.
In turn, %R sell signals appear when the indicator leaves the overbought zone from top to bottom. Such dynamics indicates the weakening of buying activity and the probable beginning of correction or trend reversal. Opening a short position in this case becomes a logical decision for the trader.
Using indicators in cryptocurrency requires a careful approach. It is recommended to confirm signals with additional analysis tools, such as the RSI indicator in cryptocurrency or trading volume data. This allows you to minimize the number of false entries and increase the reliability of trading.
Detecting overbought and oversold conditions
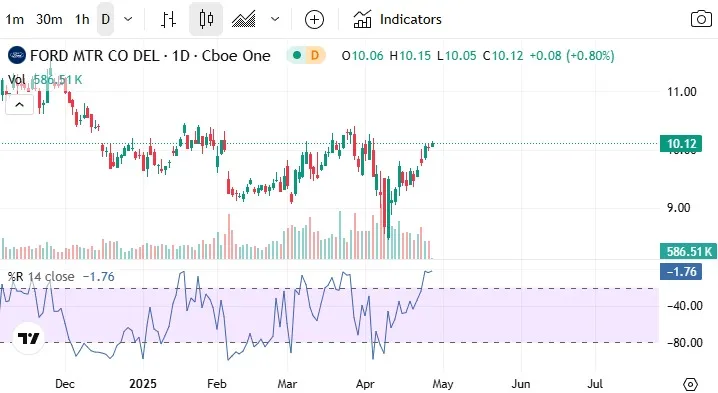
Perhaps the main feature of the Williams indicator for cryptocurrency is its ability to accurately identify overbought and oversold zones. When the %R value approaches 0 or is between 0 and - 20, it indicates that the asset is overbought. In other words, the price is close to its recent high and the market may be ready for a correction.
If the %R value falls into the range of - 0 to -100, it indicates that the cryptocurrency is oversold. The price is close to its minimum for the selected period, and an upward reversal often occurs in this zone. Understanding how to read Williams’ %R helps traders react to shifting market trends in a timely manner.
Working with overbought and oversold zones is especially effective in range trading when the market is moving sideways. However, in the conditions of a strong trend, signals from the Williams percentage range can be delayed or give false guidance. That is why a competent combination of %R with other tools, such as %R + RSI strategy, significantly improves the quality of analysis and allows you to enter trades more accurately.
Therefore, understanding buy and sell signals and correctly interpreting market conditions through %R overbought and oversold are important elements for building an effective strategy when trading cryptocurrency.
Combining Williams %R with other indicators
The Williams %R indicator is often used in tandem with other analytical tools to improve the accuracy of trading decisions. Since the Williams %R is still a leading indicator in cryptocurrency trading, it can sometimes give false signals, especially in a strong trending market. To minimize errors, traders combine it with oscillators, trend indicators and volume tools.
One of the most popular combinations is the use of Williams’ %R and RSI indicator in cryptocurrency. Both tools help to determine overbought and oversold zones, but they work according to different mathematical models. If the signals are confirmed by both indicators, the probability of a successful transaction increases significantly.
Another effective way is to use %R together with simple and exponential moving averages (SMA and EMA). Moving averages help to understand the general direction of the trend, while Williams’ %R indicates the optimal entry or exit points. This approach works well within cryptocurrency algo-trading and automated cryptocurrency trading.
It is also not uncommon to combine the Williams percentage range with volume indicators. If abnormal bursts of trading activity are recorded during an oversold or overbought signal, this strengthens the reliability of the forecast.
Here are some popular combinations:
-
Williams’ %R + RSI: helps filter out false overbought/oversold signals.
-
Williams’ %R + EMA 50/200: confirms signals in the direction of the main trend.
-
Williams’ %R + MACD: strengthens the detection of trend reversals.
-
Williams’ %R + Volume Indicators: confirms movement through liquidity analysis.
-
Williams’ %R + Bollinger Bands: shows price out of standard deviation.
The right combination of indicators makes indicators in cryptocurrency trading much more effective, minimizing risks when making decisions in a volatile market.
Who the %R indicator is suitable for and in what strategies it should be used
The Williams %R indicator is ideal for traders who are looking to catch short-term price reversals or work on corrections within large trends. It is particularly effective in sideways or weakly trending markets, where there are often clear overbought and oversold zones.
Beginner traders will find %R in crypto useful due to its ease of interpretation: the clear levels of - 20 and - 80 serve as clear guidelines for action. However, for greater reliability, beginners are recommended to use it in conjunction with additional analysis tools to avoid false entries.
Experienced traders use %R buy and %R sell signals in more complex strategies, such as the %R + RSI strategy, as well as integrate them into other popular cryptocurrency 2025 indicators to build automated trading algorithms.
This tool performs particularly well in scalping and intraday trading. In scalping, the quick reaction to changes in overbought and oversold zones allows traders to make a large number of trades in a short period of time, taking advantage of every slightest price movement.
At the same time, it is important to remember that even with the correct setting of the indicator and competent interpretation of signals, there are always risks in automated trading. Therefore, the use of %R Williams requires constant market monitoring and readiness to adapt the strategy to changing conditions.