Candlesticks and patterns in cryptocurrency
Trading in financial markets and subsequently cryptocurrencies has increasingly become based not only on fundamental factors, but also on technical details. Patterns and candlesticks themselves have been carefully studied and structured by more than one generation of traders and subsequently became the basis of universally recognized technical analysis.
What are candlesticks in cryptocurrency
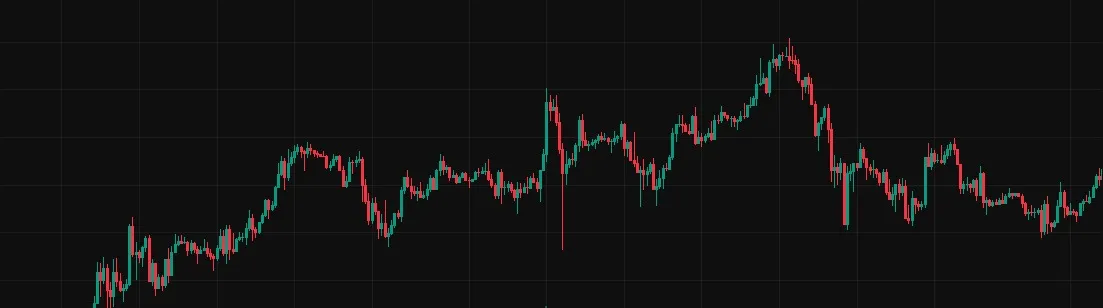
Candlesticks, or Japanese candlesticks, are a graphical method of displaying price movements in the market. Market participants use them in technical analysis, which allows traders to visually identify trends, support and resistance levels, as well as possible entry and exit points.
Each candlestick consists of four key parameters:
-
Open - the price at which the asset began trading in a given period.
-
Close (Close) - the price at which the asset finished trading in the given period.
-
Maximum (High) - the highest price for the period.
-
Minimum (Low) - the lowest price for the period.
How to read candlesticks on the cryptocurrency exchange
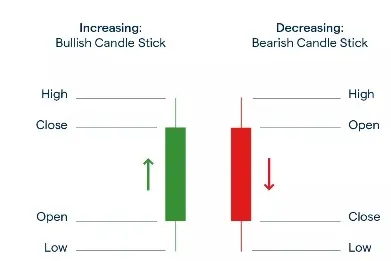
To understand how to read cryptocurrency candlesticks and market movements in general, it is important to be able to interpret the shape of candles. Crypto candles are differentiated into bullish (green) or bearish (red) candles:
-
Bullish candle - the closing price is higher than the opening price, indicates the growth of the asset.
-
Bearish candle - closing price is below the opening price, indicates a decline in the asset.
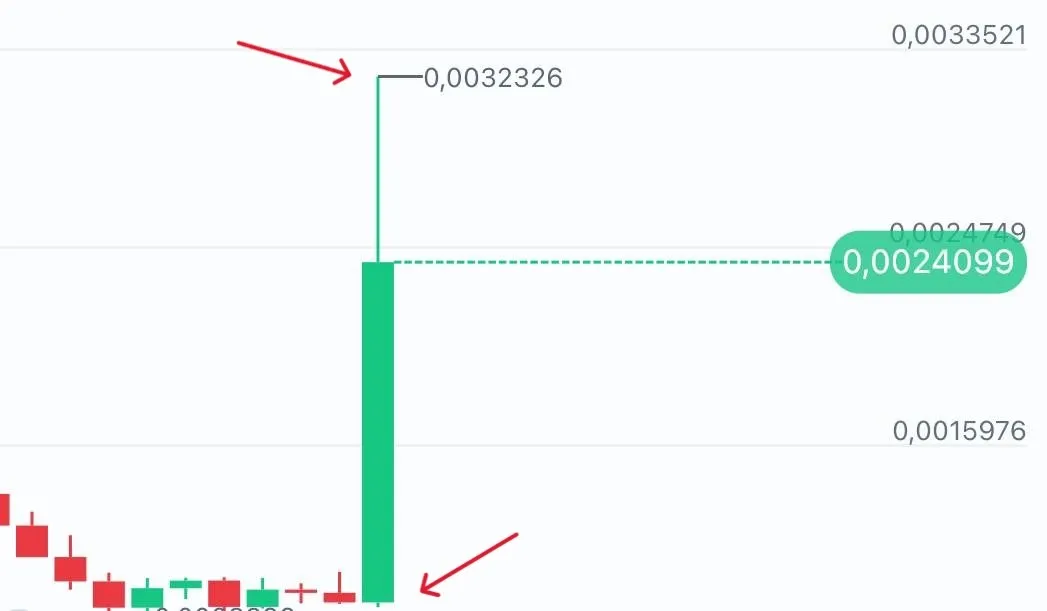
Long candlestick shadows signal high volatility, while short bodies indicate weak price changes.
Candlestick patterns in cryptocurrency
All candlestick patterns in technical analysis can be divided into two types - bullish (bull) and bearish (bear) patterns.
Bull patterns
Bullish patterns signal a potential increase in the price of an asset. One prominent example is the hammer.
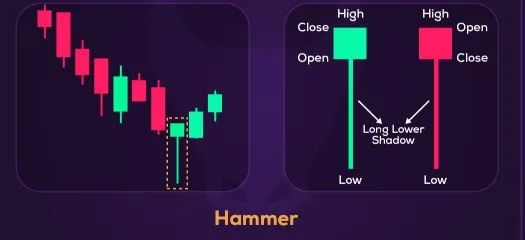
Hammer is a single candlestick with a long shadow at the bottom and a small body at the top. This candlestick pattern often signals weakness of participants (shorts) and further trend reversal upwards.
Signs of a hammer:
-
Presence of an elongated lower shadow (2-3 times larger than the candle body).
-
A small body at the top of the range.
-
Context is important: Hammer works better near support levels.
Bear patterns
Bearish patterns on a cryptocurrency chart signal a likely price drop. One famous example is Shooting Star.
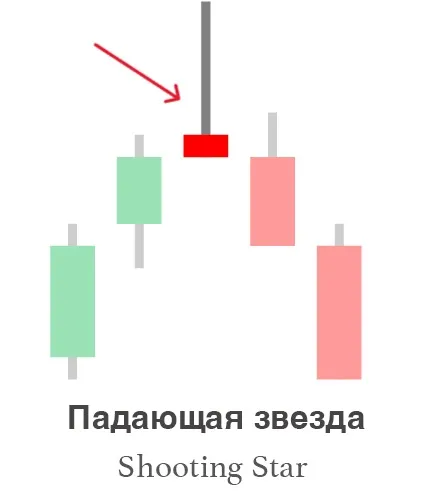
Shooting Star is a candlestick with a long shadow at the top and a small body at the bottom. It indicates weakness in bullish momentum and a potential downward reversal.
Signs of a Shooting Star:
-
Long upper shadow (2-3 times the size of the candle body).
-
A small body at the bottom of the range.
-
Formed after an upward move, often near resistance.
Advanced patterns
Some patterns require a deeper understanding of the market context. An example is Rising and Falling Three Methods.
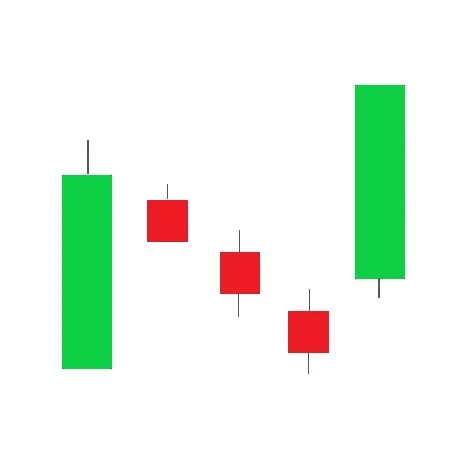
Rising Three Methods is a bullish pattern involving three small bearish candles following a much longer bullish candle. It is a bullish trend/trend continuation signal.
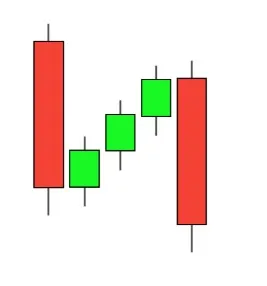
Falling Three Methods is an opposite pattern indicating a continuation of a bearish trend.
Practical application of candlesticks in cryptocurrency
1. Using candlesticks to make trading decisions.
Candlestick analysis is used in several key aspects of trading:
-
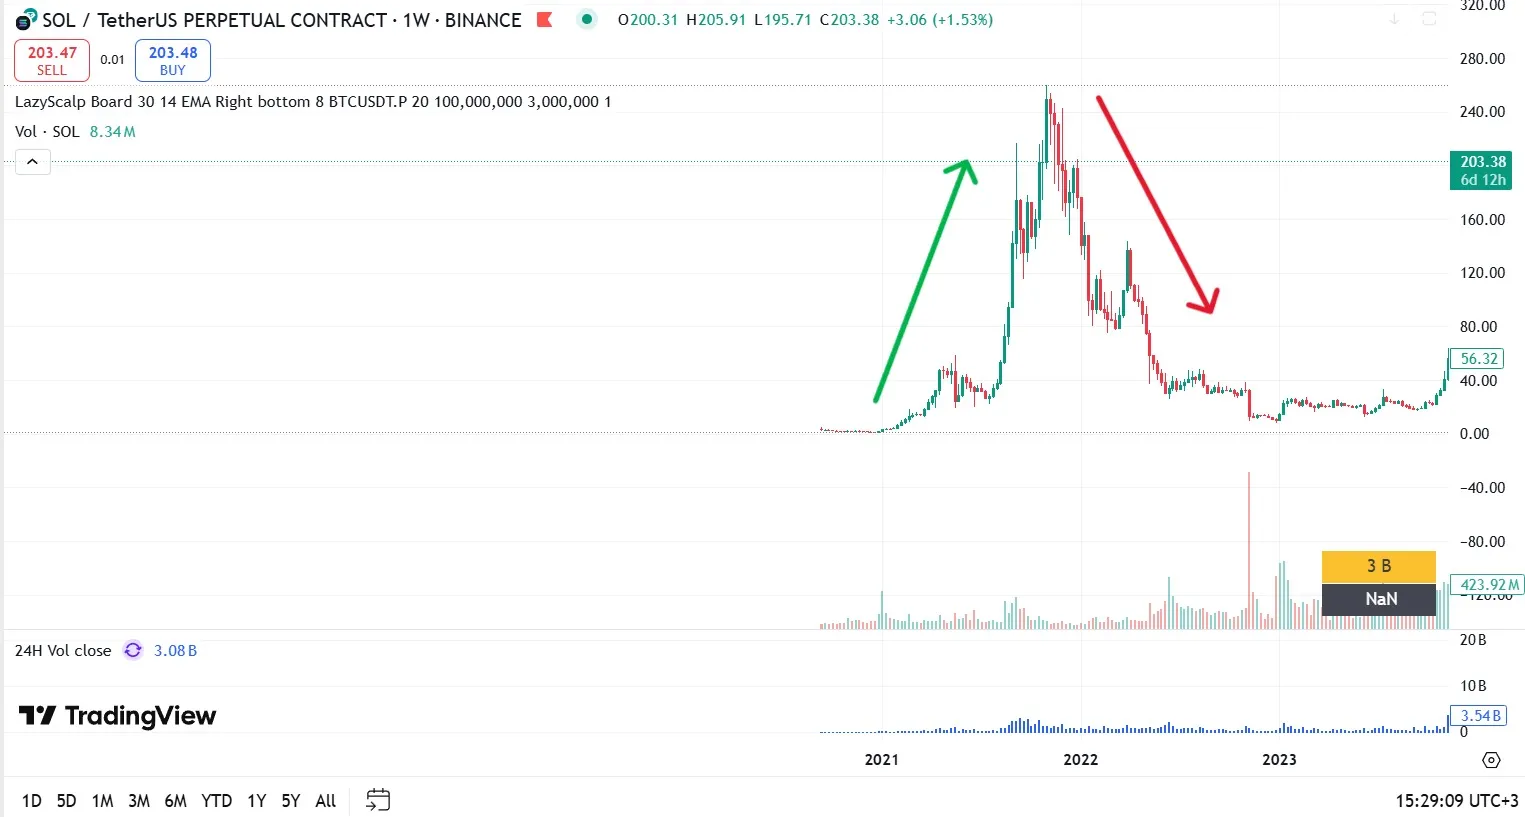
Determining a trend - by analyzing a sequence of candlesticks, you can understand which direction the market is moving in.
-
Finding reversal points - candlestick patterns can indicate a change in trend, weakness in one side of the market and short-term changes in price direction.
-
Confirming signals from other indicators - candlesticks help to confirm signals from other technical analysis tools.
-
Detecting consolidation - alternation of small candlesticks indicates the fading of movement before a possible impulse.
-
Evaluating trend strength - the length of the candlestick body and the ratio between bullish and bearish candlesticks indicate the strength of market participants.
2. Determining the trend by candlesticks
Candlestick analysis allows you to determine whether the market is in a rising, falling or sideways phase.
Bullish trend
-
A sequence of candlesticks with rising highs and lows.
-
Long green candlestick bodies indicate strength on the part of buyers.
-
Presence of candlestick patterns in support of the trend, such as the Three White Soldiers.
Bearish trend
-
A sequence of candlesticks with declining highs and lows.
-
Long red candlesticks indicate the presence of strength on the sellers’ side.
-
The appearance of downward continuation patterns such as the Three Black Crows.
Flat (sideways market)
-
An alternation of green and red candles of approximately the same size.
-
Small candle bodies and long shadows indicate uncertainty.
-
Often precedes a strong move up or down.
3. Working with support and resistance levels
Candlesticks allow you to find key levels where price reacts particularly strongly.
-
If the price bounces off a certain level several times, it confirms its importance.
-
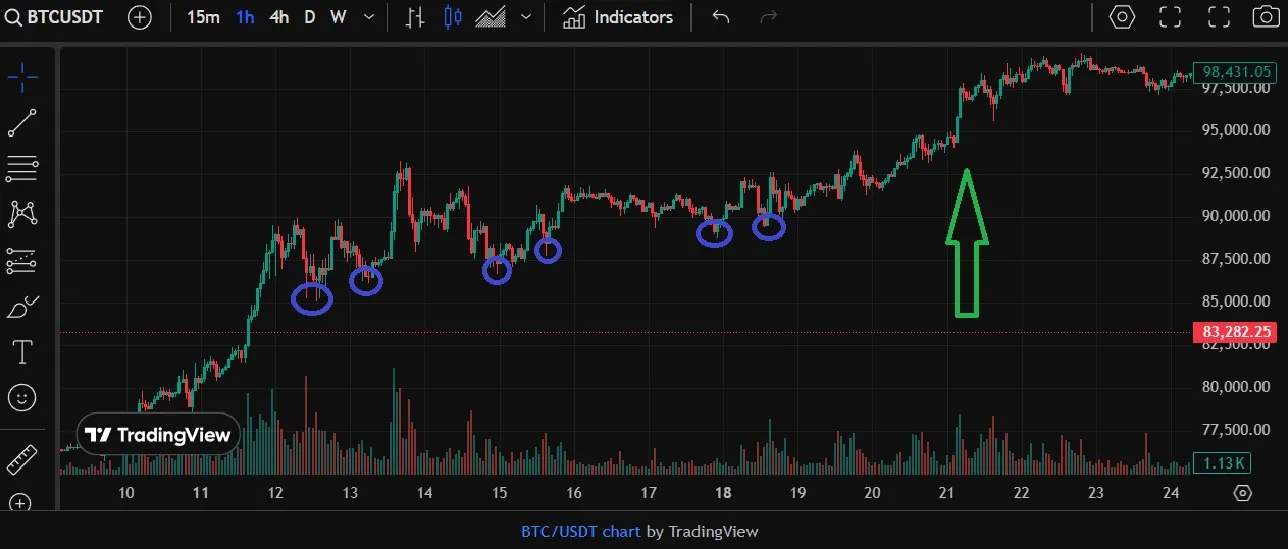
Candlestick patterns near support or resistance levels give signals to enter a trade. For example, the “Hammer” pattern near support may indicate the beginning of growth.
-
The breakdown of the level is accompanied by candlesticks with a long body and high volume. If the price consolidates above resistance, it may indicate that a continuation of growth may follow.
Example:
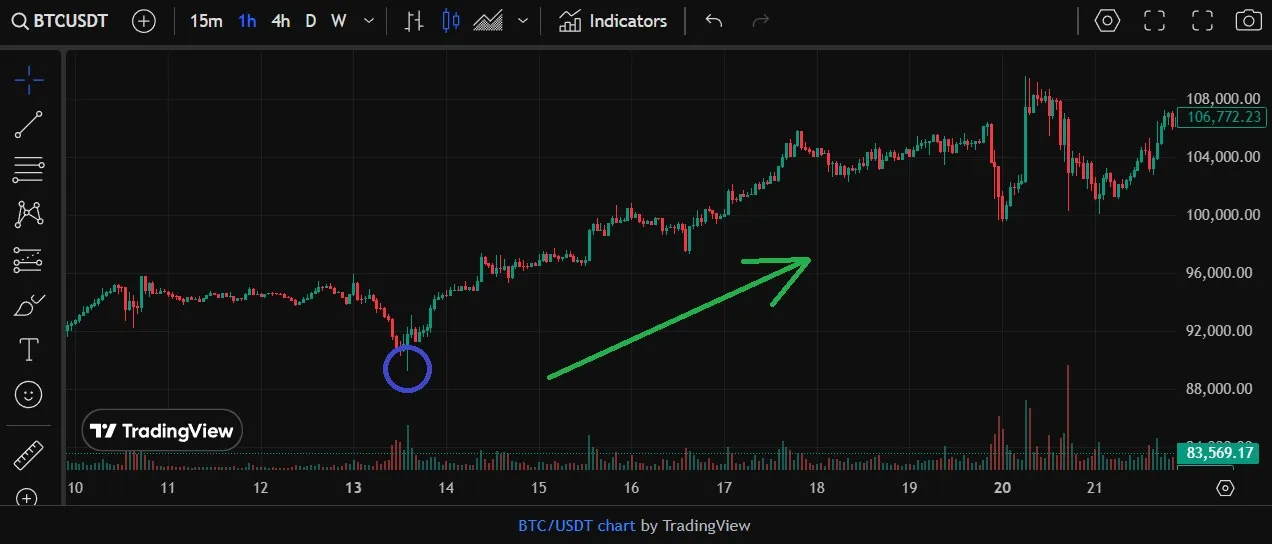
If Bitcoin bounced several times from the $40,000 level and then formed a long green candle with high volume, it could be a signal to open a long position.
4. Reversal candlestick patterns and their application
Candlestick patterns of this kind signal a possible change in price direction or trend.
Bullish reversal patterns
They are used to find entry points for long positions.
- Hammer
-
The body of the candlestick is not very large, while the lower shadow is multiples larger than it.
-
It appears at the bottom of a downtrend.
-
It is confirmed by the next green candle with increased volume.
- Bullish Takeover
-
A green candle completely overlaps the body of the previous red candle.
-
It indicates a change of market sentiment.
Bearish reversal patterns
Used for exiting long positions or opening short positions.
- Hanged Man
-
A small body, the lower shadow is a multiple of its size.
-
It is formed at the top of an uptrend.
-
It is confirmed by a red candle on the next period.
- Bearish Takeover
-
The red candlestick overlaps the previous green candlestick, showing the weakness of the buyers and their inability to hold the price.
-
It shows that the sellers have started to dominate.
5. Trend continuation by candlestick patterns
Some candlestick patterns indicate the continuation of the current movement.
-
“Three White Soldiers” - three consecutive long green candles, indicates a strong bullish momentum.
-
“Three Black Crows” - three consecutive long red candles, signaling a continuation of the decline.
-
“Flag” or ‘Signpost’ - short candles after a strong momentum indicate a temporary consolidation before the trend continues.
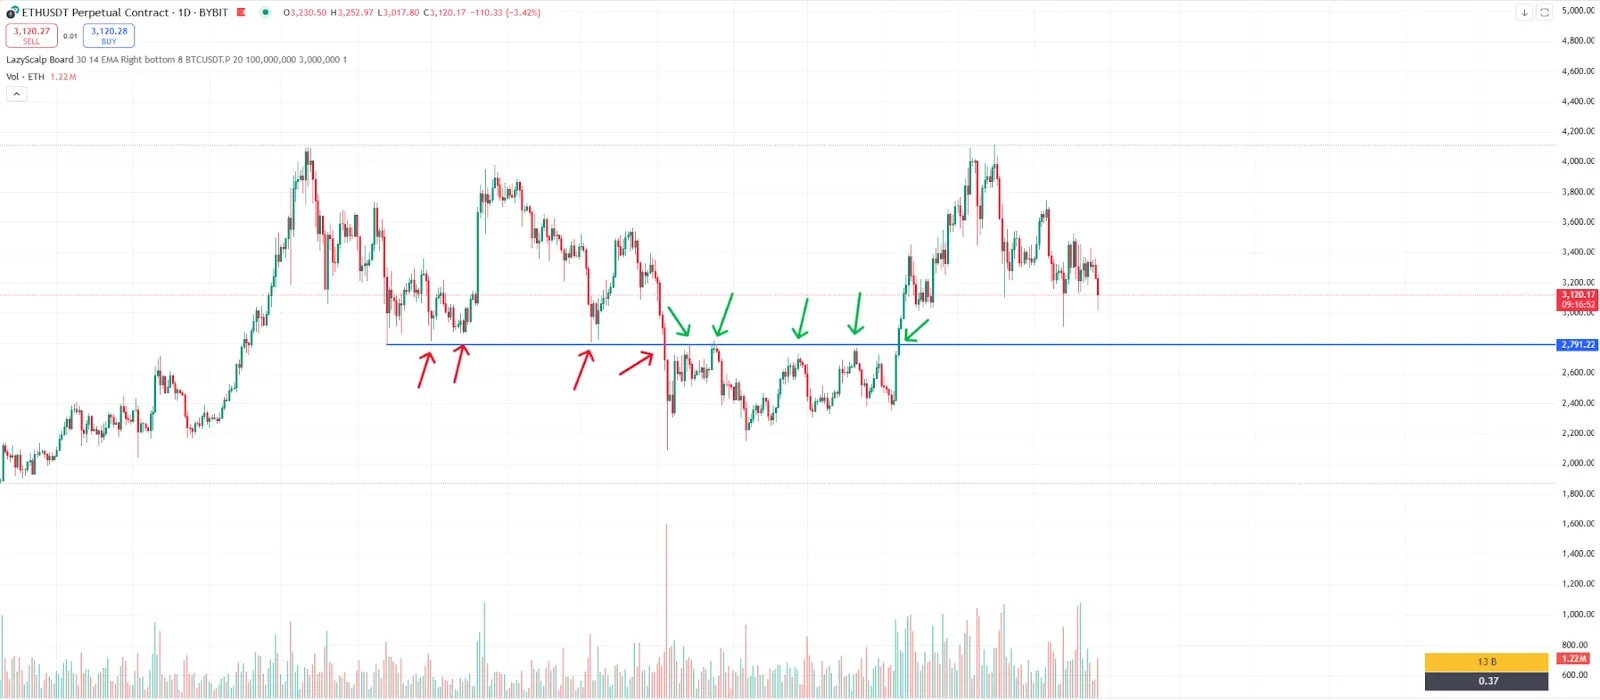
Example:
If three consecutive green candles appear after Ethereum rises to $2,500, it may indicate sellers capitulating and buyers focusing their strength, i.e. further growth.
6. Candlestick Entry and Exit Tactics
Entry tactics
-
Wait for the appearance of a reversal or long term pattern.
-
Check volumes - if the candle is accompanied by high volume, the signal is more reliable.
-
Use confirming indicators - RSI, MACD or moving averages.
-
Place a stop loss below support (when buying) or above resistance (when selling).
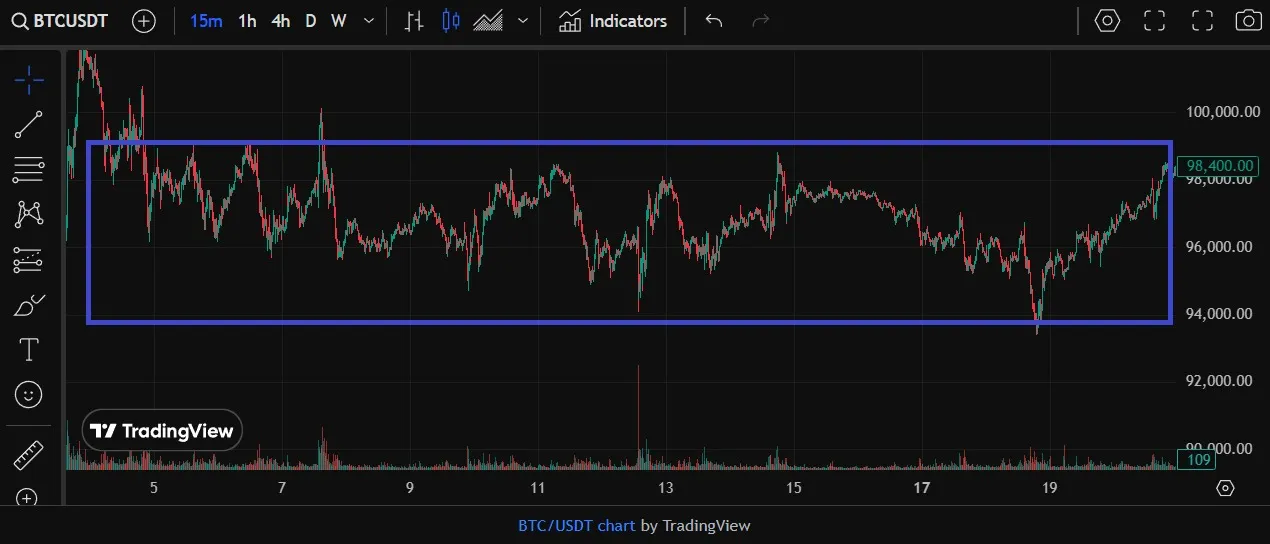
Example:
If a Bullish Takeover with high volume appears at the $90,000 level for Bitcoin, you can open a long position by placing a stop loss at $89,500.
Exit tactics
-
Profit taking when reversal candlestick patterns appear.
-
Exit when the trend weakens (decrease in candlestick length, decrease in volumes).
-
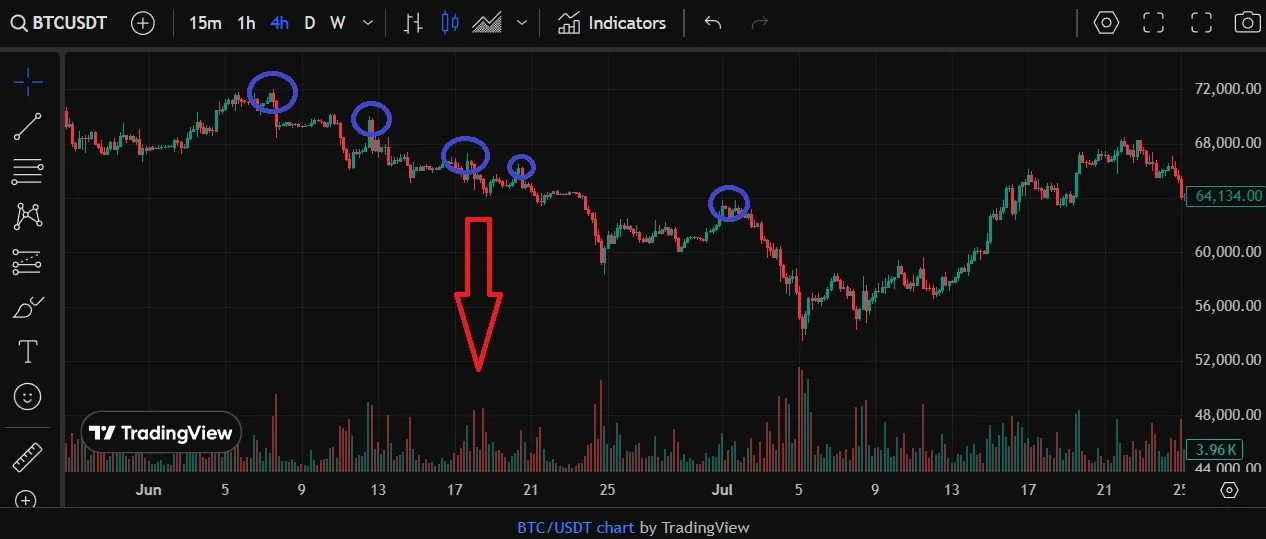
Exit when an important resistance level is reached.
Example:
If Ethereum grows and forms a “Hanged Man” at the resistance of $3,500, you can lock in profits.
Combining candlesticks with other technical indicators
It is not recommended to be guided only by technical patterns when making trading decisions. For a more objective and effective decision it is worth using in combination with patterns and other methods of technical analysis.
RSI and MACD
-
RSI (Relative Strength Index) helps to determine whether an asset is overbought or oversold.
-
MACD (Moving Average Convergence Divergence) shows how strong the trend is and its potential reversals.
Ichimoku Cloud
This indicator includes several lines representing trend, support and resistance. The combination of the Ichimoku Cloud and candlestick patterns gives reliable trading signals.
Elliott Wave Theory
Candlestick patterns can complement Elliott Wave Analysis to help identify corrective and momentum movements.
Risks of using patterns
1. limited accuracy of patterns
Problem: false signals
Not all technical analysis patterns are accurate. Chart patterns are formed in a volatile market where price is influenced by many factors, including news, fundamental events and manipulation by major players (whales).
Example:
- The Head and Shoulders model is often seen as a reversal signal. However, it is often false in cryptocurrency trading as the price can reverse sharply due to high volatility.
How to minimize risk:
-
Always wait for confirmation of a signal (e.g., breakdown of a support or resistance level).
-
Use additional indicators (RSI, MACD, volumes) to filter false signals.
-
Do not open trades based on only one pattern - take into account the market context.
2. Volatility and high volatility of the crypto market
The cryptocurrency market is characterized by high volatility, which can lead to sharp price movements that violate classic patterns of technical analysis.
Example:
- A “Flag” pattern is forming on the daily chart, indicating a continuation of the trend. However, a sudden news (for example, the regulator’s statement about the ban of cryptocurrencies in the country) can completely change the situation.
How to minimize risk:
-
Take into account fundamental factors - news, economic events, regulation.
-
Do not trade based on too shallow timeframes, where volatility can distort signals.
-
Use a wide stop loss, especially on volatile assets, to avoid accidental knockouts.
3. Late patterns
Problem: late pattern formation
Some chart patterns take a long time to form and by the time they are completed, the price may already be in a different phase of the market.
Example:
- An ascending wedge is often interpreted as a downward reversal signal. However, if it forms within a strong bullish trend, an upward breakout becomes more likely, despite the “classic” meaning of the pattern.
How to minimize risk:
-
Use multiple timeframes - check how the pattern looks on a larger scale.
-
Wait for a clear breakdown of key levels, rather than entering a trade in advance.
-
Combine patterns with market sentiment analysis (e.g. fear and greed index).
4. Manipulations and behavior of large players
Large players (“whales”) can artificially create patterns to attract liquidity and then reset positions.
Example:
- A Double Bottom formation may attract buyers expecting growth. However, once the support level is broken, large players may cause a false spike upwards and then quickly reverse the price downwards.
How to minimize risk:
-
Analyze trading volumes - if a pattern is formed without volume confirmation, it is unlikely to work out.
-
Analyze the market depth - the presence of large orders may indicate manipulation.
-
Avoid trading in periods of low liquidity, when it is easier to create artificial movements.
5. Subjectivity of pattern interpretation
Different traders may interpret the same pattern differently.
Example:
- One trader may see a “Flag” (trend continuation pattern) and another may see a “Wedge” (reversal pattern). This creates uncertainty in trading decisions.
How to minimize risk:
-
Establish clear rules for identifying patterns.
-
Do not trade on a hunch, but follow a pre-designed strategy.
-
Use algorithms and indicators that help to automate the search for patterns.
6. Mistakes associated with the use of patterns without taking into account other factors
Problem: isolated use of technical analysis
Patterns work better when combined with many other tools such as support or resistance levels, volume and fundamental analysis.
Example:
- A bullish engulfing pattern potentially signals upside, but if it forms near strong resistance, the chances of further upside are reduced.
How to minimize risk:
-
Combine different methods of analysis (technical + fundamental).
-
Take into account the news background - unexpected events can disrupt the pattern.
-
Follow macroeconomic data affecting the crypto market (e.g., Fed decisions on interest rates).
7. Improper risk management
Traders who rely only on patterns may fail to consider risks and use defense mechanisms.
The main mistakes are:
-
Lack of stop losses - the trader hopes the pattern will work out, but the price goes in the opposite direction.
-
Using excessive leverage - increases liquidation risks.
-
Incorrect risk/reward ratio - if the stop loss is too close, the trade may close prematurely.
How to minimize risk:
-
Always use stop losses and take-profits.
-
Apply the 2% rule - do not risk more than 2% of your deposit in a single trade.
-
Choose trades with a minimum risk/profit ratio of 1:2 or higher.
Conclusion
Candlesticks and candlestick patterns are essential attributes for reading basic chart information in both crypto trading and trading in general. However, just like any other technical or fundamental analysis tool require experience, lots of practice and combination with other indicators for effective use. Traders should be aware of the risks and carefully analyze each trading signal.
FAQ
1. What are the main candlestick patterns used in cryptocurrency?
Some of the most popular ones include: hammer, shouting star, doji, engulfment, pin bar and three candlestick patterns.
2. How to identify trends using Japanese candlesticks?
A trend can be identified by a sequence of candlesticks. If the price forms higher lows and highs - the trend is upward, if vice versa - downward.
3. What indicators are best to combine with candlestick patterns?
RSI, MACD, Ichimoku cloud and moving averages work best.
4. How to manage risk when using candlestick patterns?
-
Use stop losses.
-
Check signals with other indicators.
-
Avoid trading on too low timeframes.
5. What are some effective strategies for cryptocurrency trading using candlestick patterns?
-
Trading on support and resistance levels.
-
Combining candlestick patterns with volumes.
-
Using confirming indicators (RSI, MACD).