
Ishimoku Cloud: how to read and use the indicator
Financial markets use a variety of effective indicators to make trading more convenient and potentially profitable. One of these technical analysis tools is the Ishimoku Cloud, an indicator that provides traders with important data, from market trends to chart levels and signals for making trades.
What is the Ishimoku Cloud?
The Ishimoku Cloud is a Japanese analytical tool developed by Goichi Hosoda. Its main feature is that it combines several functions at once, allowing you to get a comprehensive picture of the market from a single indicator.
The main difference of the Ishimoku cloud from many other tools is its ability to forecast the development of events, providing data not only in real time, but also ahead of time. This makes it especially valuable in dynamic and highly volatile markets, including cryptocurrency markets.
What the Ishimoku indicator consists of
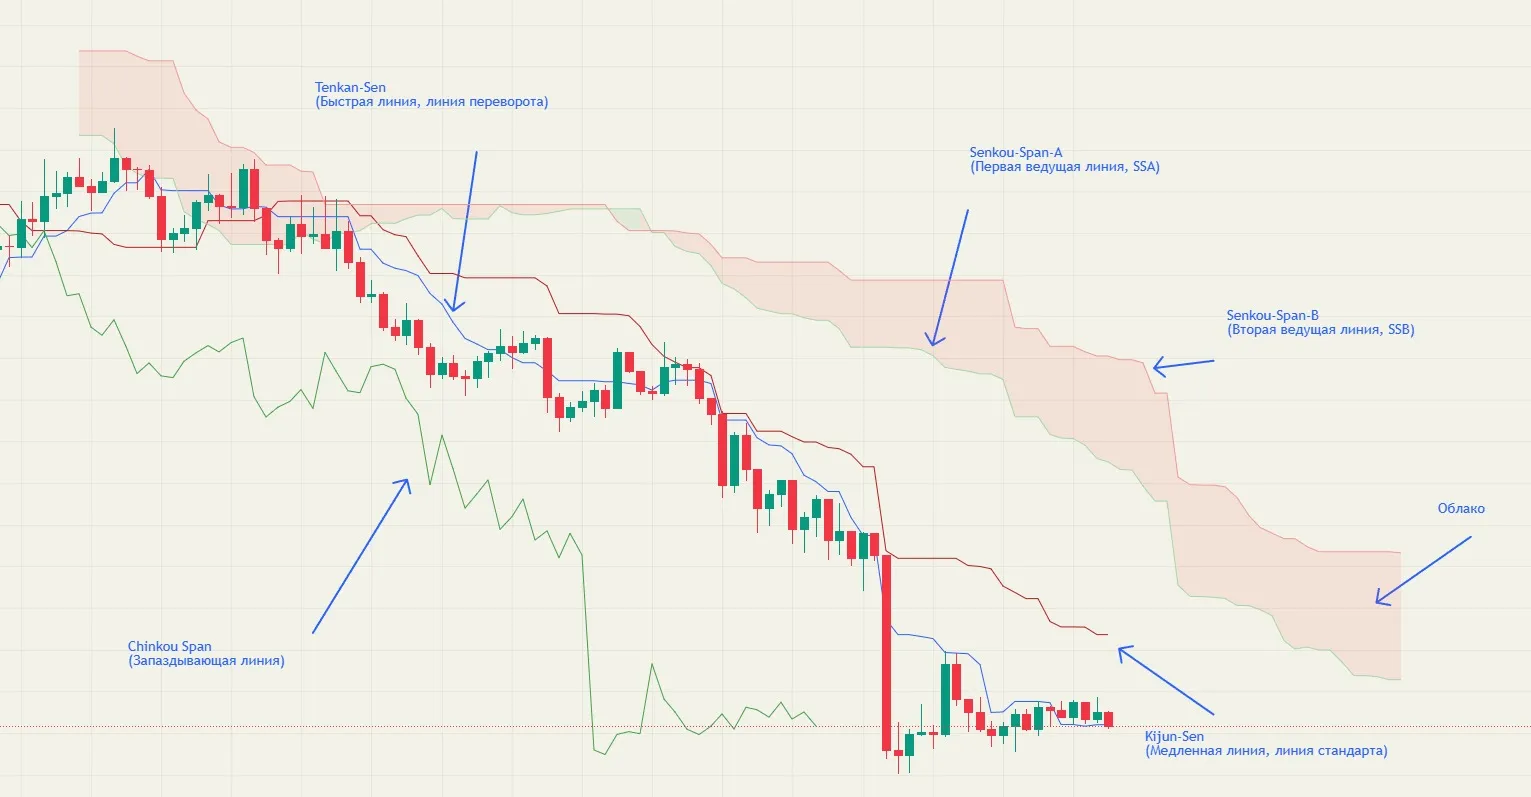
The entire cloud system is based on five main lines, each of which has its own unique role. To competently apply the indicator in your trading, you need to know the purpose of these elements:
Tenkan-sen and Kijun-sen
Tenkan-sen (usually displayed as a red line) is a quick average line calculated as an average value for the extreme 9 candles.
Kijun-sen (blue line) is a slow average line formed on the basis of 26 periods. It shows a more stable, medium-term trend.
Senkou Span A and Senkou Span B
Senkou Span A is the first cloud line, derived as the average between the Tenkan and Kijun lines, shifted forward by 26 periods.
Senkou Span B is the second line, which is calculated based on 52 periods and is also shifted forward. The distance between these lines forms a cloud (Kumo). The color of this cloud helps to visually determine the prevailing trend on the chart.
Chikou Span
Chikou Span is a lagging line, which represents the closing price that has been moved back by 26 periods. Its task is to confirm the relevance of the current trend.
How to interpret cloud signals
In order to get the most out of working with this indicator, you need to correctly interpret its signals.
Quick buy and sell signals
The Tenkan-sen and Kijun-sen lines are some of the most important components. The crossover of these lines from bottom to top, you can understand it as a signal to open a long position. A reverse crossover indicates a possible start of a downtrend.
Price location relative to the cloud:
- A price above the cloud indicates an upward movement.
- A price below the cloud signals a downtrend.
- A price inside the cloud most often indicates consolidation or sideways movement.
Thanks to its versatility and visibility, the Ishimoku Cloud indicator has become an indispensable tool for traders, especially in the rapidly changing cryptocurrency environment, where the speed of decision-making is crucial.
Examples of using Ishimoku in crypto
1. Golden Cross signal (Bullish Cross)
Prerequisite: Tenkan-sen crosses Kijun-sen from bottom to top.
Interpretation: Strong bullish signal
Example: BTC/USDT (daily chart)
After consolidation Tenkan crosses Kijun upwards. This confirms the presence of a trend and may be a signal to enter the long position.
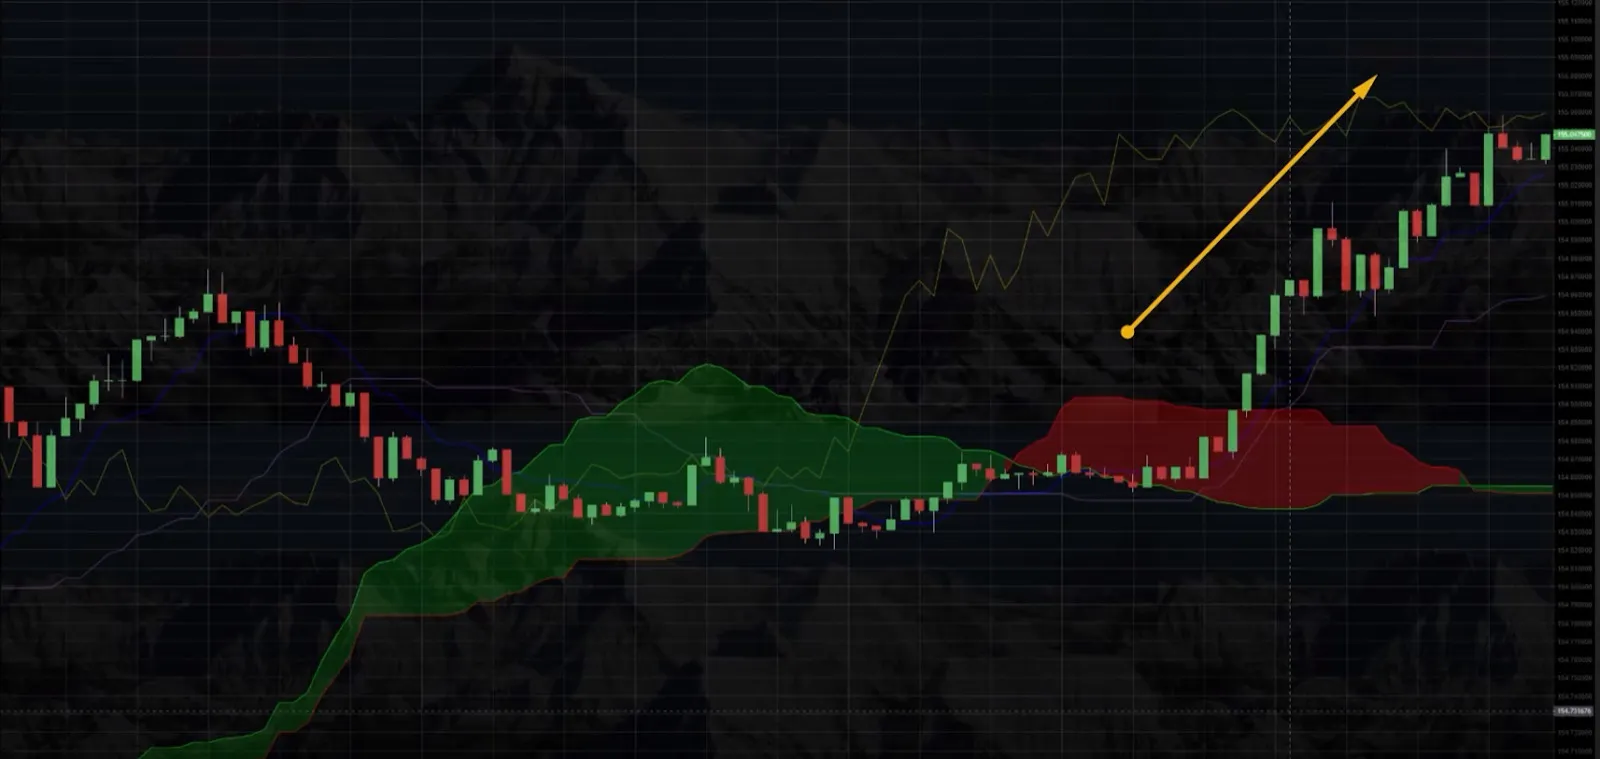
2. Cloud Breakout
Prerequisite: The price breaks the cloud from the bottom to the top.
Interpretation: A change from a bearish trend to a bullish trend.
Example: ETH/USDT
The price is long under the cloud, then breaks it upwards and consolidates. This is a reversal signal and an opportunity to enter long.
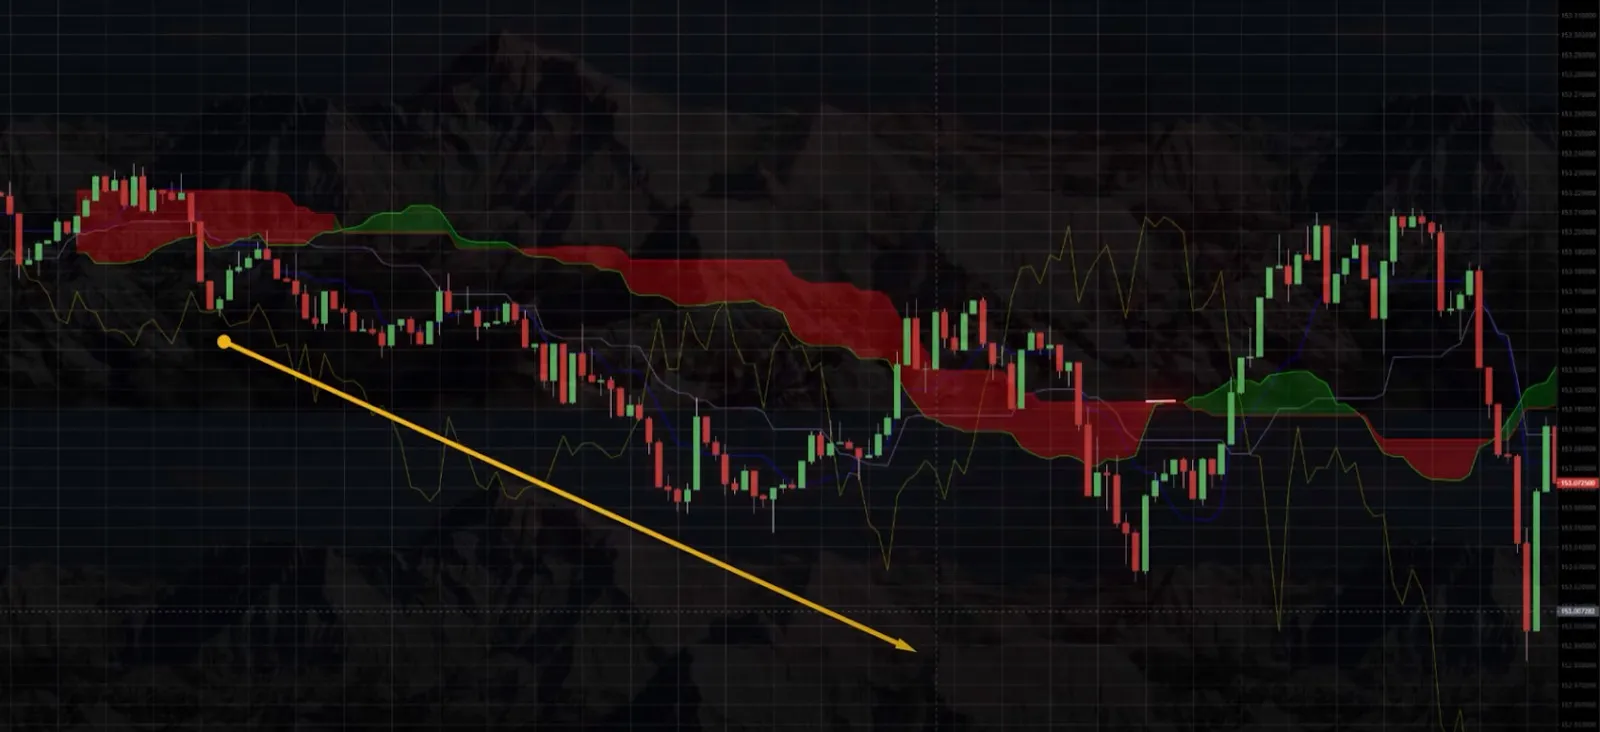
3: Cloud as support/resistance
Prerequisite: The price is approaching the cloud and pushing away from it.
Interpretation: The cloud works as a dynamic level.
Example: SOL/USDT
Price is approaching the cloud in a downtrend and is pushing away from the upper boundary (Span A). This could be a short entry point.
4. Take Profit and Stop levels on Span B
Condition: Price is approaching the Senkou Span B line.
Interpretation: Potential movement target or resistance zone
Example: BTC futures
After long entry, the price approaches the upper boundary of the cloud (Span B) - a possible level of partial profit taking or breakeven.
5. Trend confirmation with Chikou Span
Prerequisite: Chikou Span is above the price and the cloud (for long).
Interpretation: Confirmation of a bullish trend.
Example: ADA/USDT
The price is above the cloud, Tenkan is above Kijun, but Chikou is still below the price - the signal is not fully confirmed yet, it makes sense to wait.
Combining the Ishimoku with other indicators
To strengthen the Ishimoku signal, it is often combined with other analysis tools. Useful indicators for cryptocurrency trading that combine well with the Ishimoku:
1. Ishimoku + RSI (Relative Strength Index)
How it works:
- Ishimoku shows the trend
- RSI shows overbought/oversold areas
How to use:
Long: Price above the cloud, RSI comes out of oversold (went above 30) - buy signal
Short: Price below the cloud, RSI has come out of overbought (below 70) - buy signal
Example:
ETH/USDT is above the cloud (bullish trend) + RSI went down to 35, then reversed - entry to long on the trend on the correction
2. ishimoku + MACD
How it works:
-Ishimoku shows the global trend
- MACD confirms the strength/direction of the momentum
How to use:
Trade exclusively on the direction of the cloud, enter on MACD crossing (MACD and signal line) in the direction of the trend
Example:
BTC/USDT is above the cloud + MACD forms a bullish crossover - signal to open a long position.
3. ishimoku + Volume
How it works:
- Ishimoku cloud gives breakout signals
- Volume confirms the strength of the move
How to use:
A breakout of the cloud or an important line (e.g. Kijun) is confirmed by rising volume - an entry signal.
Example:
Price broke the cloud upwards, but volume did not increase - possible false breakout.
If the volume is high, there is a higher probability of a continuation of the movement.
4. Ishimoku + Stochastic Oscillator.
How it works:
- Ishimoku determines the trend
- Stochastic Oscillator helps to enter a trade on a pullback.
How to use:
In a bullish trend (price above the cloud) wait for the Stochastic to enter the oversold zone (below 20), then crosses up - enter long; in a short - vice versa.
Example:
SOL/USDT is above the cloud + Stochastic enters oversold and crosses up - enter long on the pullback.
5. Ishimoku + Price Action (candlestick analysis)
How it works:
- Ishimoku determines the trend and levels
- Candlestick patterns help to choose the entry point more precisely.
How to use:
Enter on patterns (engulfment, pin bars, doji) on the borders of the cloud.
Example:
Price tests the Kijun line from below, forms a bullish engulf - enter long.
Conclusion
Now you know how to use the Ishimoku Cloud and all its functions. Having mastered it, you will get an advantage in market analysis, especially in conditions of high volatility, typical for cryptocurrencies.
FAQ
1. Is the Ishimoku Cloud a lagging or leading indicator?
Partially leading (Span A and Span B) and partially lagging (Chikou Span), which makes it unique.
2. What is the best timeframe to use the Ishimoku?
It works best on daily and four-hour charts, but is adaptable to any.
3. Is the Ishimoku cloud suitable for cryptocurrency trading?
Yes, especially due to its ability to filter out false signals in volatile markets.
4. Which signals are considered the strongest?
Tenkan/Kijun crossing + cloud breakout + confirmation of the Chikou Span.
5. Should I use Ishimoku without other indicators?
You can use it, but for reliability it is better to combine it with RSI, MACD, volumes or use other indicators for cryptocurrency trading.