
Trading Reversals: how to spot and use a trend change
Among traders, the phrase “Trend is your friend” is popular. Indeed, it’s better to befriend the trend and thereby go with the flow, extracting profit from its predictable moves. However, sooner or later any trend ends or shifts. For a trader to profit from this, it’s necessary to know how to trade trend reversals.
What Is a Trend Reversal
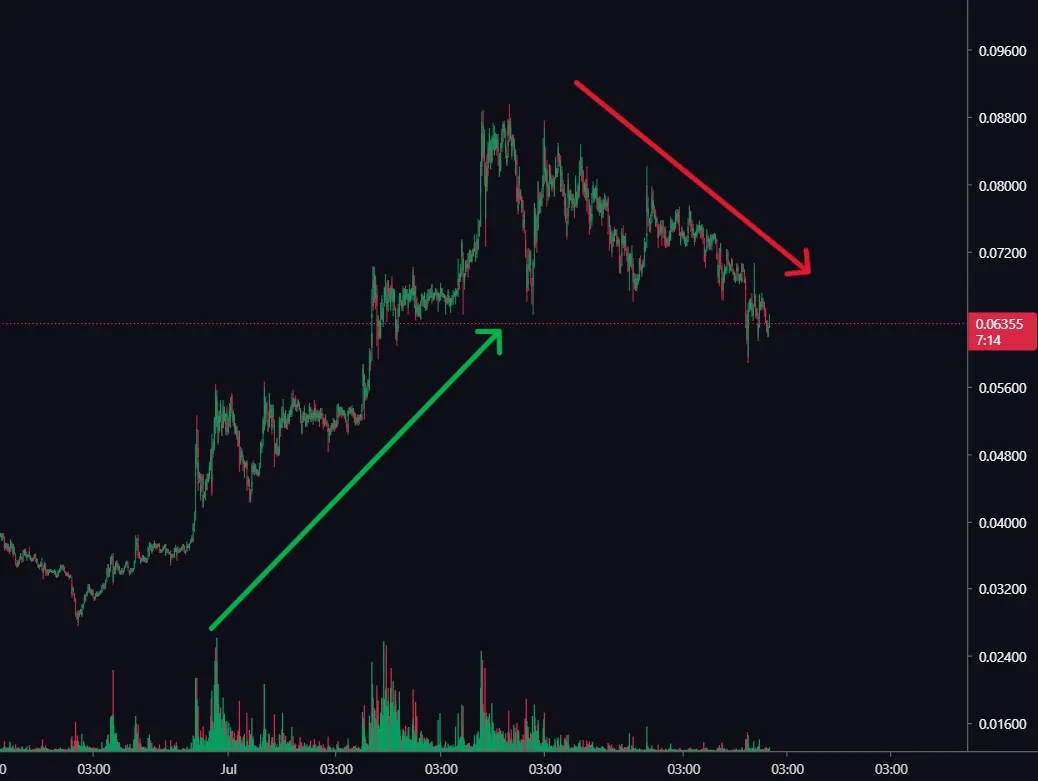
Trading reversals is one of the most common strategies in the technical analysis of any market. A trend reversal means a change in the asset’s price direction: for example, a short‑term bullish trend in Bitcoin shifts to a bearish one.
In crypto trends, where the movement can be rapid, you must be able to recognize the reversal point in time to extract maximum profit and minimize potential risks.
But learning at once to distinguish a trend reversal from a correction is not easy and requires proper experience.
Main Reversal Signals on the Chart
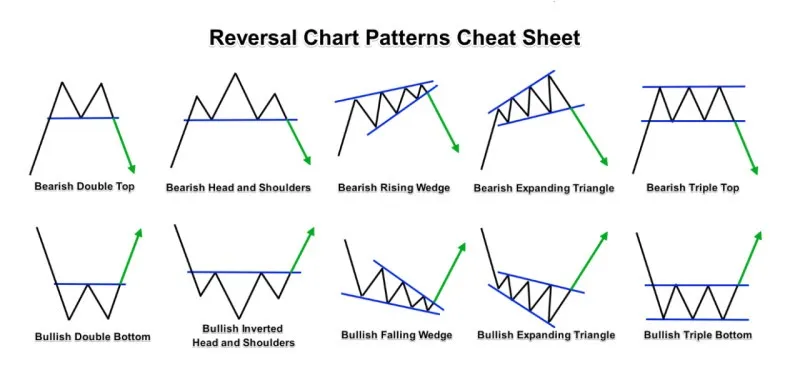
You can identify trend reversal signals visually, using elements of classical technical analysis. These include popular chart reversal patterns such as “Head and Shoulders,” “Double Top,” “Wedge,” and others. They form at the peaks or bottoms of the chart and signal an impending trend change in trading.
An additional signal comes from trend reversal candles. Japanese candlesticks such as the “Hammer,” “Hanging Man,” or “Engulfing,” especially near strong levels, can indicate the weakening of the current trend. A breakout of key support or resistance levels also suggests a possible trend change.
How to Use RSI, MACD, Stochastic
Indicators provide deeper analysis when you need to confirm the market’s intent. Some traders prefer trend reversal without indicators, relying on the clean chart, but using technical tools increases entry accuracy.
Here are some of the most popular indicators:
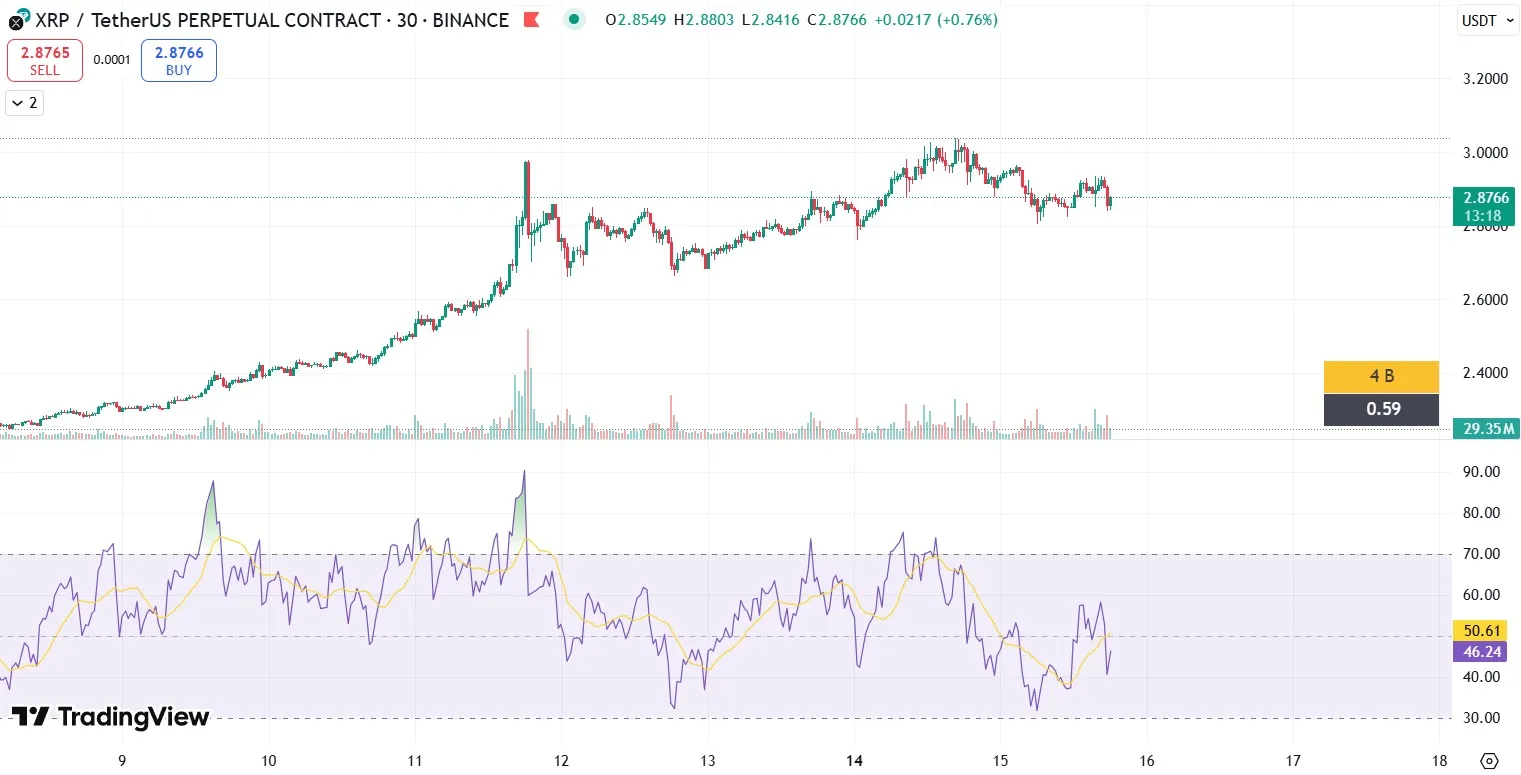
Shows overbought and oversold zones. When the indicator exits the 70 or 30 levels, especially with a divergence from the price chart, it may signal an imminent trend reversal.
- MACD
Helps determine the strength and direction of the trend. The crossing of the signal line and the formation of divergence can be an early signal. This indicator shows a trend reversal in advance and is most optimal on higher timeframes.
- Stochastic
Gives signals within extreme zones—above 80 (overbought) and below 20 (oversold). Its signals work especially well on coins and markets with ranging movement.
Using RSI, MACD, and Stochastic in isolation does not guarantee success. The best results are achieved when they are interpreted together in the context of the overall technical analysis of the chart. For example, if an indicator shows a trend reversal in advance and at the same time a “Double Bottom” pattern or a “Hammer” candle forms at a support level, this greatly increases the chances of a successful entry.
At the same time, it’s important to remember that absolutely any signals must be accompanied by risk management and a clear action plan. Ideally, every trader should backtest indicator behavior to make sure they are effective for their trading system—especially if you aim to trade a trend reversal without repainting or use your own algorithms focused on price behavior.
Examples of Reversal Strategies
The first strategy is working with divergences between price and the indicator. When the price makes a new high and RSI or MACD shows a decline, a full signal for a trend reversal forms. This strategy gives an advantage in anticipating movement early and is effective when used in trading bots due to the quick detection of divergence or overbought/oversold conditions.
The second strategy is based on combining trend reversal candles with strong/historical levels. For example, when the price approaches a resistance level and a “Bearish Engulfing” pattern appears, this may indicate an impending reversal and, accordingly, seller strength. You can act similarly at support when a “Bullish Hammer” forms.
The third strategy is using chart reversal patterns such as the “Double Bottom” or “Inverse Head and Shoulders.” After the pattern completes and the neckline is broken, you can enter the market expecting a trend change.
Common Beginner Mistakes
Many novice traders try to catch the trend reversal point too early, without waiting for confirmation. This leads to nothing but losses and a loss of confidence in the trading strategy. Beginners also often rely on only one indicator, forgetting the importance of a comprehensive approach. They ignore volumes, news background, and current volatility, which can radically influence price movement.
In addition, some attempt to use a non‑repainting trend reversal indicator, relying on little‑known tools that lack proper testing. Remember that even the oldest and most proven indicators show a trend reversal in advance only if there is competent context and a combination of factors.
FAQ
-
How to identify a trend change in cryptocurrency?
Use a combination of chart analysis, candlestick patterns, and technical indicators. At the same time, remember to pay attention to volumes and the news background. -
Which indicator shows a trend reversal in advance?
The most effective are MACD, RSI, and ADX. Visual divergence between price and indicator often warns of an upcoming reversal. -
Can you trade a reversal without indicators?
Yes, it’s possible. Price action trading is a methodology that uses only trend reversal patterns and price behavior at strong support/resistance levels. -
Which candles are most informative during a trend reversal?
Classic candlestick patterns—“Hammer,” “Doji,” “Engulfing,” “Hanging Man.” Their strength increases with volume and a confirming chart pattern. -
How to distinguish a correction from a reversal?
A reversal is accompanied by a breakout of strong levels and a change in the structure of highs/lows. A correction is a temporary pullback within the current trend, not a complete change of it.