What are doji candles in trading
Technical analysis is the basis for decision-making for most traders. Currently, there are many types of technical analysis figures and candlestick patterns. We will discuss one of these candlestick patterns in more detail.
What are Doji Candlesticks
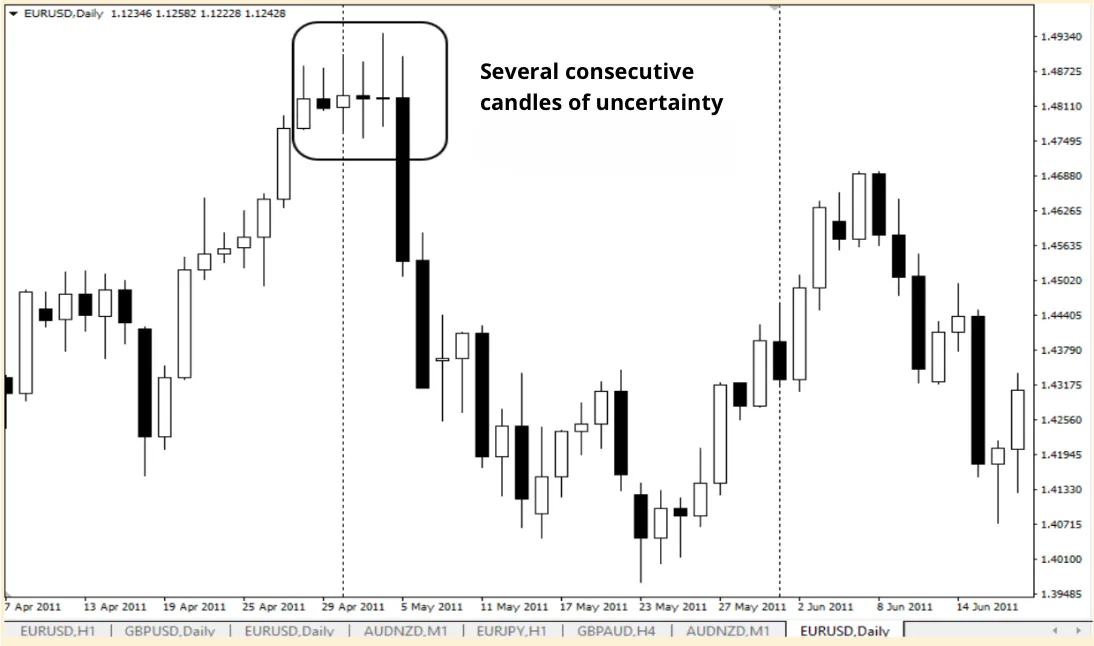
Doji candlesticks are one of the most recognizable elements of candlestick patterns used in technical analysis. They reflect a state of uncertainty in the market when the forces of buyers and sellers are almost equal. In the classic Japanese candlestick model, a doji looks like a candlestick with a very small or no body and long shadows above or below. That is why, when analyzing a chart, such a candlestick often signals that the market is in a state of anticipation and the trend may be preparing to change direction.
What does a doji candlestick mean for traders? It all depends on the context and the position of the candlestick on the chart. In some cases, it indicates a possible trend reversal, and in others, a strengthening of the current movement. For an accurate interpretation, it is important to consider it in conjunction with other candlestick patterns and support or resistance levels, as well as within the framework of your trading system.
The main types of doji candles
There are several varieties of doji candles, each of which has its own meaning and helps traders make decisions:
-
Standard doji — a candle with short shadows and a minimal body. It usually indicates consolidation and a balance of power between buyers and sellers.
-
Long-legged doji — characterized by long shadows above and below. This is a strong signal of uncertainty and a possible reversal candlestick pattern.
-
Dragonfly Doji — a candlestick with a long lower shadow and almost no upper shadow. Most often forms at the bottom of a trend and indicates a possible upward reversal due to the strength of buyers.
-
Gravestone Doji — the opposite of a dragonfly. The candlestick has a long upper shadow and a short lower shadow. It appears at the peaks of growth/the final stage of the altseason and signals a possible price decline due to the strength of sellers.
-
Four-price doji — a rare variant without shadows, when the opening, closing, maximum, and minimum prices coincide. It is usually found in illiquid markets.
Knowing the different types of doji allows you to better understand all candlestick patterns in trading and their meaning, as well as find graphical trading patterns that help predict price behavior.
The significance of doji candles in technical analysis
Doji candles occupy a special place in technical analysis, as their appearance on a chart often indicates uncertainty in the market and a possible change in the mood of traders.
Unlike regular candles with a pronounced body, a doji is formed when the opening and closing prices are almost the same. Thus, they reflect a situation where the forces of buyers and sellers are balanced, and the market cannot decide on the direction of further movement. Therefore, the significance of candlestick patterns involving doji is directly related to understanding market psychology and the behavior of major players.

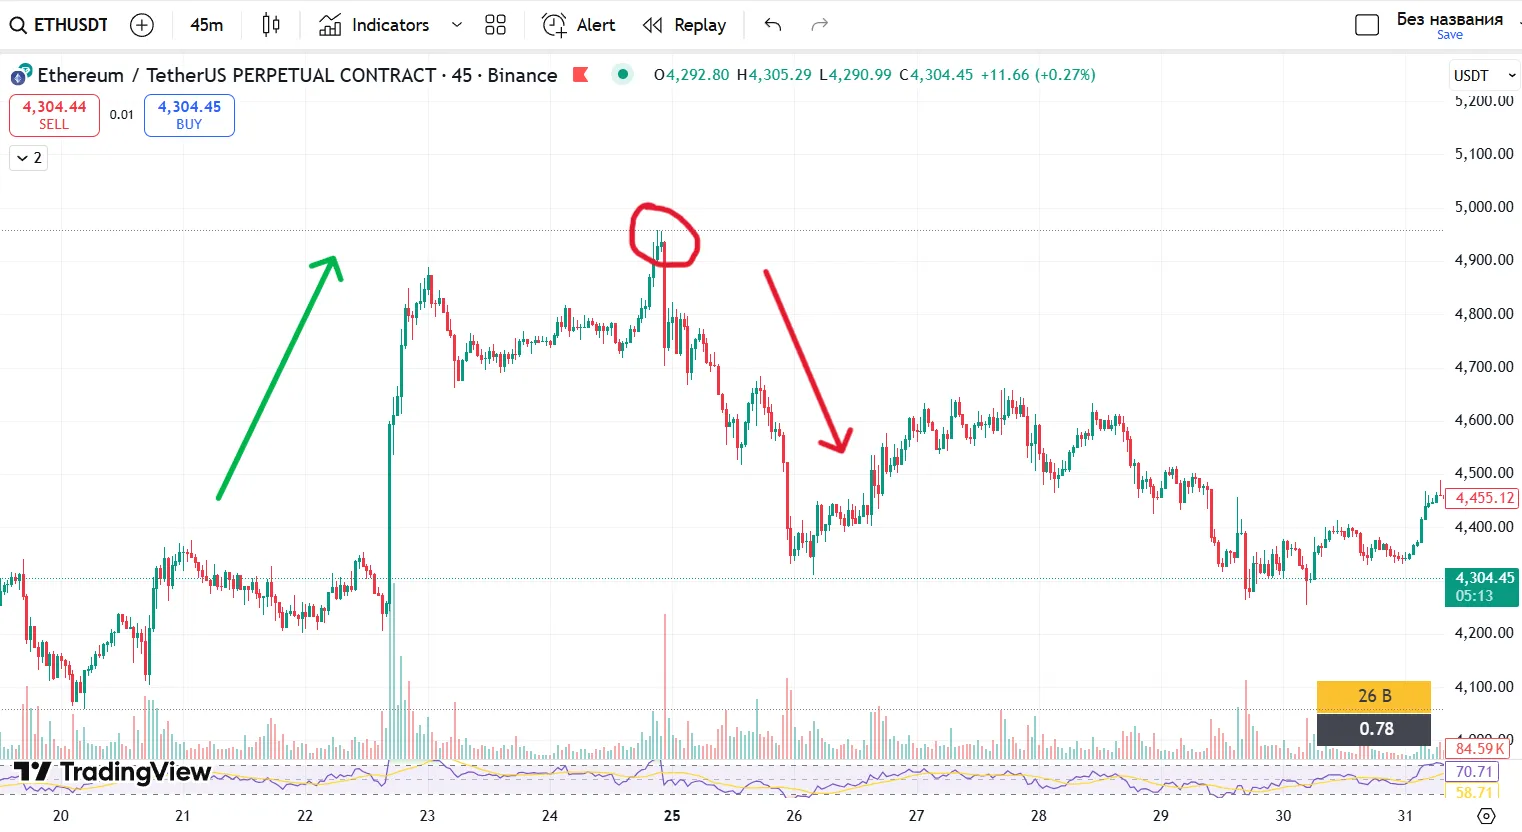
When analyzing doji, it is very important to consider the market context. If the candlestick appears after a prolonged uptrend, it may serve as a warning that buyers are beginning to lose control and the upward movement is gradually exhausting its potential. In such situations, doji is often seen as a signal for a trend reversal, especially if the subsequent candlestick confirms the change in sentiment, forming a classic reversal candlestick pattern. Similarly, in a downtrend, the appearance of a doji near support levels may indicate that sellers are weakening and the market is preparing for a correction or reversal.

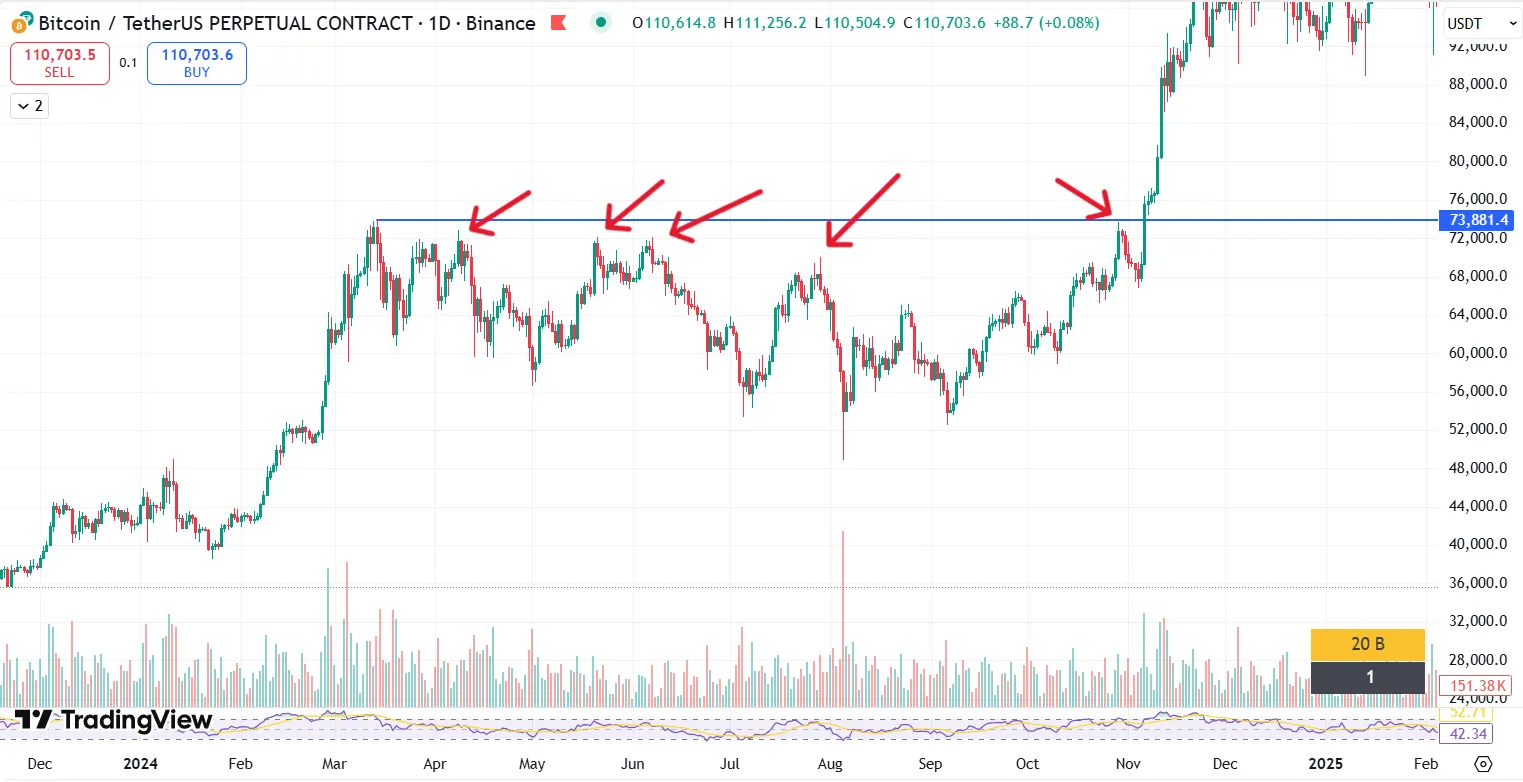
The significance of a doji is enhanced if it appears near historical levels (the example in the photo above shows the historical high for Bitcoin in 2024), strong support and resistance levels, or is accompanied by a change in trading volume. For example, if a candlestick forms at a historically important level and there is a simultaneous increase in volume, this increases the likelihood that the current trend will end and the opposite movement will begin. In such cases, traders consider doji to be one of the strongest candlestick analysis patterns, indicating a shift in the balance of power in the market.
However, a doji does not always mean a reversal. In some cases, it can signal consolidation and preparation for the continuation of the current trend. For example, in an upward movement, the appearance of a white doji candle on a small volume often indicates that the market is pausing before a new upward impulse. That is why competent traders do not rely solely on one candlestick, but always analyze it in conjunction with other candlestick patterns in trading, indicators, and chart patterns in trading.
How to trade using doji

To understand how to read a doji candle and use it in trading, as we have already established, it is important to consider the context in which it appears. The same formation can have different meanings depending on the trend and trading volume.
If a doji appears at the top of a strong upward movement, it is often seen as a signal for a trend reversal. In this case, traders may close long positions or open short ones. If the candlestick appears at the bottom of a decline, many traders perceive it as a possible bottom and look for entry points to buy.
Another way to trade with doji is to use confirmation. That is, after the candle appears, it is worth waiting for the next candle, which will confirm or refute the expected direction of movement. For example, if a strong bearish candle forms after a doji, this strengthens the signal for a decline and reduces the likelihood of a false signal.
Mistakes in interpreting doji candles
Misunderstanding the meaning of doji and its role in candlestick analysis patterns can lead to incorrect trading decisions and losses. Let’s take a closer look at the most common mistakes in detail and in order.
1. Interpreting doji as a 100% reversal signal
Many novice traders believe that the appearance of a doji candlestick automatically means a change in the direction of the trend, but this is nothing more than a common misconception. In fact, doji is only an indicator of uncertainty, not a guaranteed reversal. In some cases, the market continues to move in the same direction, ignoring the signal. To avoid mistakes, it is necessary to analyze the context of the candlestick’s appearance, compare it with the support or resistance level, and use additional tools such as candlestick pattern indicators and trading volumes.
2. Ignoring the trend and market context
The significance of candlestick patterns in trading cannot be assessed without understanding what is happening in the market as a whole and at the moment. If a doji forms in the middle of a strong trend movement, it most often signals a temporary pause rather than a change in direction. Many traders make the mistake of opening opposite positions without waiting for confirmation. For example, in an uptrend, a doji candlestick in the middle of the movement may simply indicate consolidation before a new upward impulse.
3. Neglecting confirming signals
The correct use of doji candles requires the trader to wait for confirmation from other candles or indicators. However, many make the mistake of opening trades immediately after the appearance of a doji candle.
As a result, you can get a false signal when the market makes a sharp move in the opposite direction to expectations. Therefore, experienced traders always use a combination of candlestick patterns, support and resistance levels, as well as chart patterns to verify the reliability of the signal.
4. Lack of trading volume analysis
Volume is an important factor that determines the strength and reliability of trend reversal signals.
The mistake is that traders analyze candlestick patterns without taking into account these very passing volumes. For example, a doji that appears at a high volume level is much more significant than a similar candlestick with low liquidity. Ignoring this aspect leads to incorrect forecasts and premature entries into a trade.
5. Relying on only one analysis tool
Some traders perceive candlestick patterns as the only source of information and completely ignore other methods of technical analysis. In the long run, this is a serious mistake, since even the most accurate patterns, including doji, require confirmation from trend indicators, oscillators, or news background. Trading based on a single signal often leads to the loss of your deposit, especially in volatile markets such as cryptocurrency.
FAQ
1. What does a doji candlestick mean?
It shows that buyers and sellers are evenly matched and often signals market uncertainty or a possible reversal.
2. How to read a doji candlestick?
First, you need to determine the context: what movement preceded the candlestick, are there any support or resistance levels nearby, and do other indicators confirm the signal?
3. What does a white doji candlestick mean?
It indicates that buyers were able to push the price up, but the forces of the two sides are still equal. This may indicate a slowdown in growth or an impending reversal.
4. What candlestick patterns are associated with doji?
The most well-known are the dragonfly, gravestone, and long-legged doji. These reversal candlestick patterns are quite important for finding entry and exit points.
5. Can the candlestick pattern indicator be used to analyze doji?
Yes, most modern trading platforms allow you to automatically find such signals, which simplifies the analysis of trading chart patterns.