What is a rising wedge in trading?
In the world of technical analysis, the rising wedge is considered one of the main bearish patterns signaling a possible reversal of the uptrend. Understanding its peculiarities and correct application in trading can significantly increase the effectiveness of both manual and automated trading strategies.
Rising Wedge Indicator

Let’s consider what this figure is and how it differs from other candlestick patterns.
Definition and visual signs
Rising wedge is a graphical figure formed by two converging trend lines, both of which are directed upward. The support line (lower boundary) has a steeper slope than the resistance line (upper boundary). This indicates a slowdown in the upward movement and possible exhaustion of the bullish momentum.
Key visual signs include:
-
Gradual narrowing of the price range.
-
Formation of successive higher highs and higher lows.
-
Decrease in trading volumes as the pattern develops.
How to distinguish it from other patterns (e.g., a channel)
Unlike a price channel, where support and resistance lines are parallel, a rising wedge has converging lines. This narrowing indicates a decrease in volatility and a possible trend change. In addition, in the channel, price movement occurs within a stable range, while in the wedge there is a gradual slowdown in growth.
How an ascending wedge is formed
The formation of an ascending wedge begins after a sustained uptrend. As the price moves upward, the momentum weakens, which is reflected in the slower growth of the highs compared to the lows. This leads to a narrowing of the price range and the formation of a wedge structure. The decline in trading volumes during this period confirms the weakening of bullish pressure and strengthens the probability of a trend reversal.
Meaning of a rising wedge
Each pattern in technical analysis signals a certain variant of future developments. A rising wedge is predominantly considered a bearish signal.
Bearish signal
A rising wedge is often considered as a bearish signal, especially when it is formed after a prolonged uptrend. A break of the lower support line with increasing trading volume confirms the reversal and signals the beginning of a downward movement. Traders use this signal to open short positions or take profits on long positions.
Examples of trading on the rising wedge
Below are examples of trading on this pattern on different cryptocurrency markets.
On the spot market
In the spot cryptocurrency market, for example, when trading BTC/USD, the formation of a rising wedge can herald a correction after a prolonged rise. Participants holding the asset and noticing such a pattern can prepare for a possible price decline by setting stop losses or opening short positions after the breakout is confirmed.
On futures and with leverage
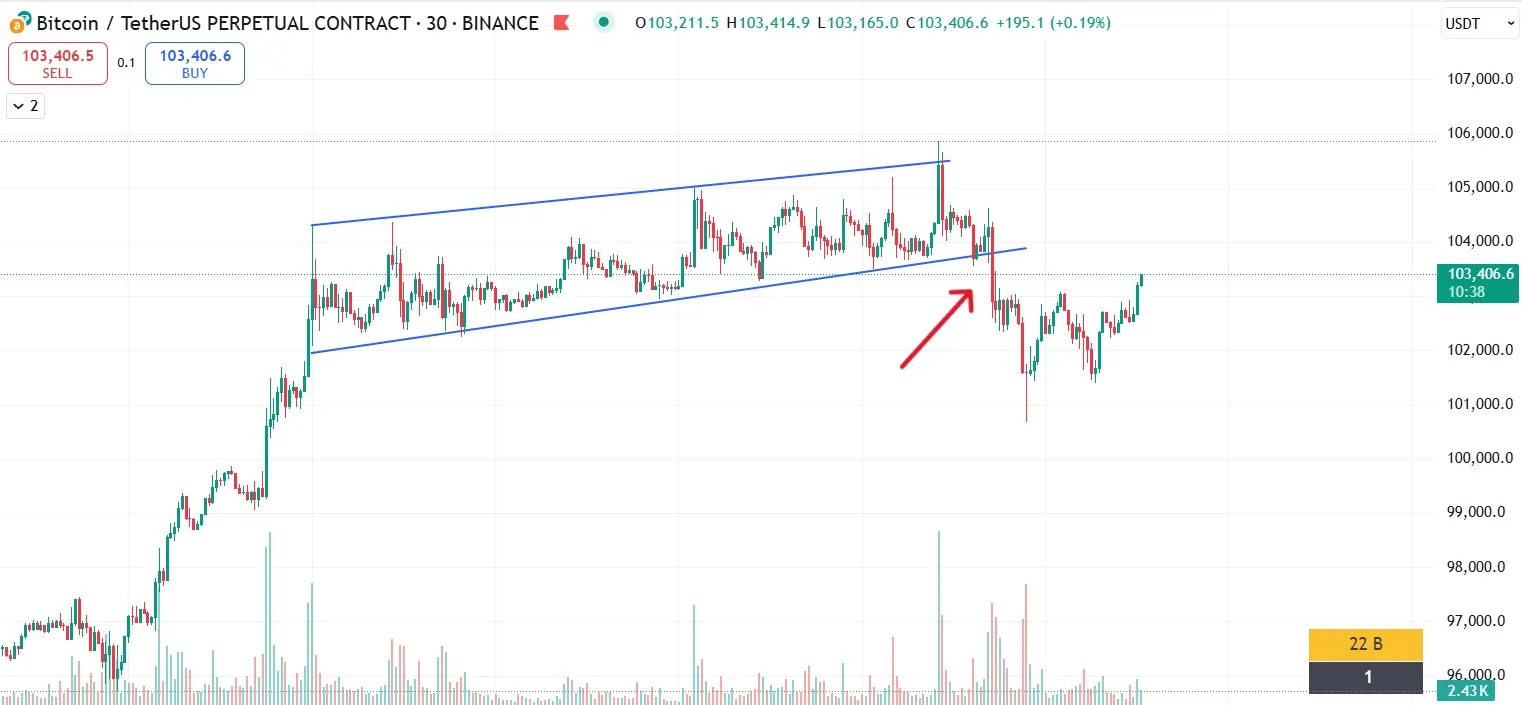
When trading futures or leveraged, the rising wedge becomes a particularly important signal. Because from it you can go long (on the rebound) or short (on the breakout). At the same time, due to the increased risk associated with margin trading, timely recognition of the pattern and taking appropriate measures (e.g. closing positions or placing protective orders) helps to minimize potential losses.
Rising wedge and trading bots
With the high volatility of the cryptocurrency market, the use of trading bots is becoming more and more relevant. Modern bots are able to automatically recognize chart patterns, including the rising wedge, and make trading decisions without the trader’s involvement.
For example, Veles bot offers the ability to integrate technical indicators and patterns into automated strategies. This allows you to not only react to rising wedge signals in a timely manner, but also combine them with other indicators such as RSI or MACD to improve the accuracy of your predictions.
Understanding and properly utilizing the rising wedge in trading can greatly enhance the effectiveness of trading strategies. In the next article, we will look at how to integrate this pattern into more complex strategies by combining it with other technical analysis tools.