
The Edison Strategy
Thomas Edison, the legendary inventor, once said, “I have not failed. I’ve just found 10,000 ways that won’t work.” His persistence in creating the electric light bulb became a symbol of perseverance and experimentation. The Edison strategy in algorithmic trading is inspired by this approach: maximum diversification, accurate signals, and resilience to market challenges. Like Edison, who tested thousands of materials for the filament, this strategy seeks profitable entry points, turning each new trade into a step toward success.
The basis of the strategy
In the late 1870s, Edison began working on the incandescent light bulb. His team conducted countless experiments, testing materials for a filament that could withstand high temperatures and shine for a long time. It was only in 1879 that carbonized bamboo became the solution that brought him a patent and recognition. This path is full of analogies with algorithmic trading: every trade is an experiment, and every failure is a lesson.
The Edison strategy works with hundreds of assets, just as Edison worked with thousands of materials. Maximum diversification reduces risks, and clear signals on small impulses ensure stable profits. Small stop losses are rarely fixed, but thanks to a stable averaging grid and indicators, the strategy remains in the black in the long run.
Indicators and order grid
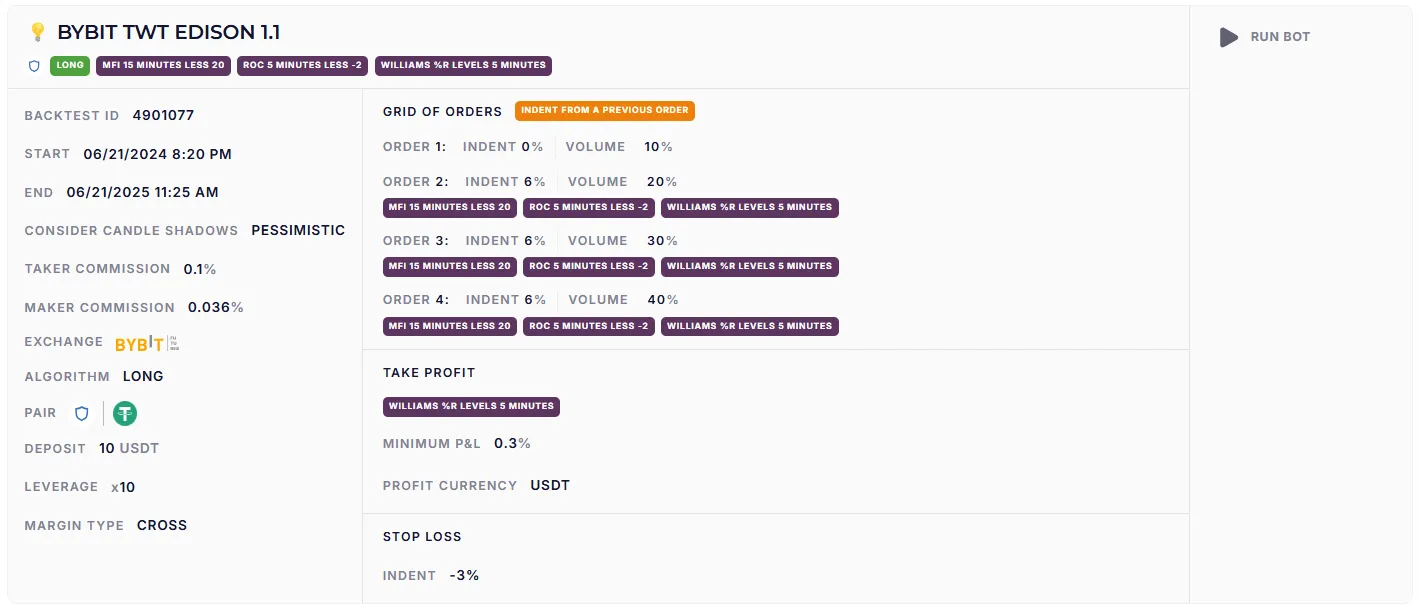
The strategy uses four orders to average the position, as in the ELDER spot strategy, but with 6% gaps between orders. The minimum grid width is 24%, which allows you to work effectively on moderately volatile assets. Let’s look at the underlying indicators:
MFI (Money Flow Index): searching for oversold conditions
A money flow index on a 15-minute timeframe with a level below 20 indicates that an asset is oversold. Just as Edison searched for a durable material for his light bulb, the MFI identifies moments when the market is “overheated” in the direction of sales, creating the potential for a reversal. We discussed MFI in detail in our article on the Boggard strategy.
ROC (Rate of Change): capturing momentum
A price change indicator on a 5-minute timeframe with a value below -3.5 helps to capture moderately strong momentum. It’s like Edison testing the heating of a filament: ROC measures how quickly the price is changing, allowing you to enter a trade that is not in a flat. For more information on ROC, see the article on the “La Catrina” strategy.
Williams %R: the heart of the strategy
The Williams %R indicator on a 5-minute timeframe is the basis of Edison. It measures the price position relative to the range for the selected period, identifying overbought and oversold zones. Trading is conducted from one level crossing to the next, which minimizes false signals. W%R smooths out market noise, allowing you to accurately enter a trade and hold your position until you make a profit. It’s like an inventor cutting out unsuitable options: clearly, methodically, and effectively.
W%R is not used in isolation. Its power is revealed in combination with MFI (volume analysis) and ROC (momentum). Together, they create a system that is resistant to market spills and pumps, like Edison’s light bulb is resistant to heat.
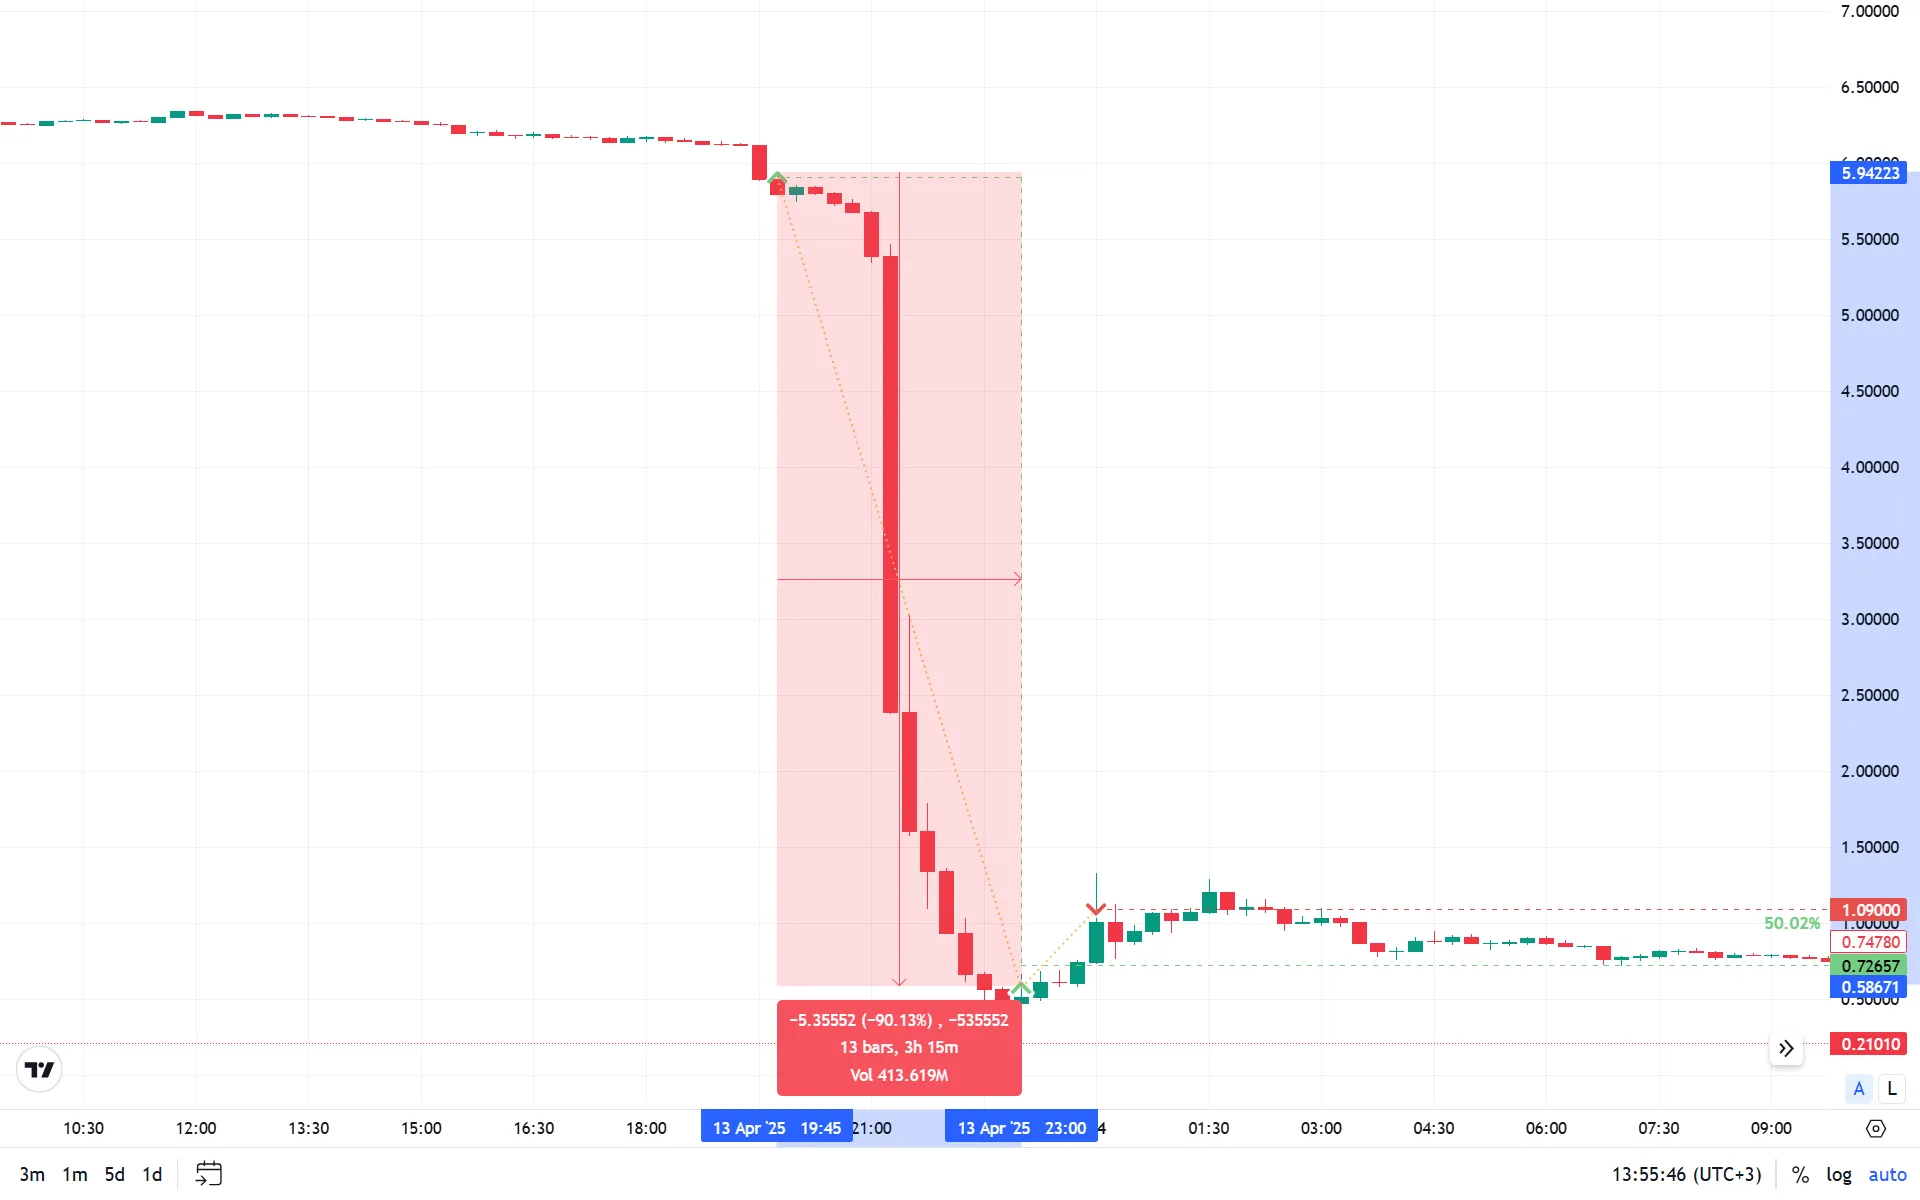
Backtests and examples
The Edison strategy has proven itself on moderately volatile assets. Backtests demonstrate stable results:
The performance on strong trends is particularly impressive. For example, according to OM assets, the strategy recorded a profit on the second order despite a deep decline. The drawdown did not exceed the deposit, which confirms the stability of the approach.
Optimization: experiments in the spirit of Edison
Just as Edison never rested on his laurels, so too can a strategy be improved. You can try reducing the grid to two orders instead of four to lock in slightly higher profits on W%R level breakouts. You can also adjust the stop loss after the second order to protect against deep drawdowns. These experiments will help you adapt the strategy to different assets and trading styles while maintaining its versatility.
Versatility and combinations
Edison works on 15-minute and 5-minute timeframes, catching entry points thanks to simple but effective indicators. W%R smooths out market noise, minimizing false signals, which makes the strategy suitable for assets with high liquidity ratios. It is effective during deep spills, allowing you to profit from sharp movements.
Combine Edison with other strategies from the cycle, such as Galileo or Newton. Use limiting the number of bots in a deal, just as Edison controlled his experiments.
Invent like Edison
Thomas Edison showed that success is the result of thousands of attempts, each of which brings you closer to your goal. The Edison strategy embodies this principle: diversification, accurate indicators, and stability make it a powerful tool for algorithmic trading. Test, study, optimize — and, like the great inventor, you will find your “light bulb” that will shine with profit in the long run.