Veles Filters Setup: How RSI and CCI Will Save Your Deposit from Buying the Peak
February 2026 is no walk in the park. The market is nervous, liquidity is jumping, and Bitcoin is exhausting traders with dumps and sharp bounces. In such moments, the crowd is driven by FOMO (Fear Of Missing Out) and panic.
You wake up, open the terminal, and see red numbers. Your bot accumulated positions at the very top of a massive green candle, just a second before market makers crashed the price. This is a classic case of buying the top, and it can drive anyone into a loss.
In this article, we will break down the mechanics of the two main bodyguards of your deposit — the RSI and CCI indicators. We won’t give you magic settings because they don’t exist. But we will give you the logic to achieve safety through Veles.
Market Peaks: Why Old Textbooks Lie
A market peak is a moment of hysteria. In traditional finance, an asset is considered overheated if it has grown rapidly. But we are in crypto. Here, a meme coin or a fundamental altcoin on strong news can ignore gravity for days and weeks.
If you simply punch template settings from a 1998 trading textbook into your bot, you will either miss 90% of profitable moves, or the algorithm will enter a long right before a harsh dump.
In Veles, filters work like face control. The trigger might scream: “Hey, we broke the level, time to buy!”, but if the filters see overheating, they block the trade. By the way, specifically for the current situation, we have prepared safe strategies with precious metals for you.
RSI (Relative Strength Index): The Market’s Speedometer
RSI measures the speed and magnitude of price changes. Imagine you are driving on a highway. RSI shows how hard the gas pedal is pressed to the floor. The scale is from 0 to 100.
- Overbought Zone (closer to 100). Buyers are pressing the gas to the floor. The engine is roaring, the car is flying, but fuel (liquidity) is running out. Entering a long at this moment means jumping into a sports car heading straight for a concrete wall.
- Oversold Zone (closer to 0). Panic. Everyone is selling. The car has stopped.
How to Use This in Veles
You can configure the bot to categorically ignore purchases if the RSI on the selected timeframe is off the charts. The main mistake beginners make is looking for a golden number. It doesn’t exist. For heavy Bitcoin, overheating occurs at certain values, while for volatile Solana — at completely different ones.
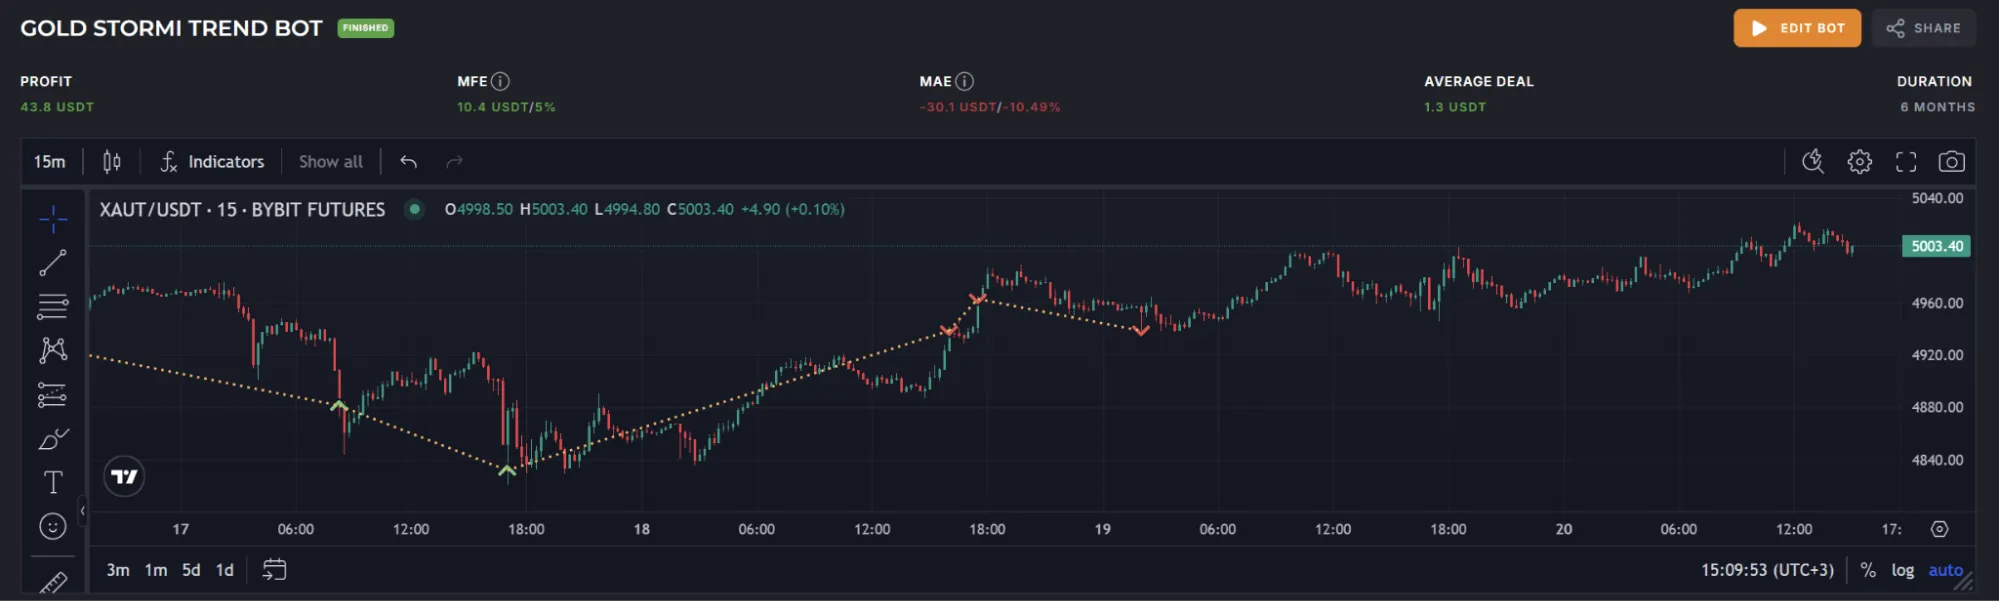
Your task is to open the chart of the desired coin, look at the history of past pumps, and determine at what RSI values the price usually fell off a cliff in backtests. This is the exact number you should set as a limit in the bot’s filter.
CCI (Commodity Channel Index): The Elastic Band
If RSI is the speedometer, then CCI is an elastic band tied to the average price of the asset.
The indicator measures the deviation of the current price from its statistical norm. It has no strict boundaries (from -100 to +100 is just the base zone; during strong impulses, the indicator can fly into cosmic values).
- When the price grows smoothly, CCI fluctuates within normal values.
- When an inadequate vertical shot (anomaly) occurs, CCI flies high into the positive. The elastic band is stretched to the limit.
How to Use This in Veles
CCI works perfectly as a filter against “God candles”. By setting a ban on entry at extremely high CCI values, you block the bot from buying at the top of a parabolic growth. Yes, you will become a pullback catcher. Trade frequency will drop, but capital safety will multiply.
Synergy and Fractality: The Pro’s Secret Weapon
A single indicator can be wrong. RSI can get stuck in overbought territory during a strong trend, and CCI can give a false signal on 1-minute noise.
The real magic of Veles is revealed in combinatorics and working with timeframes (fractality).
Hard Link (“AND” Logic)
You can add both indicators to the bot’s configuration at once. The platform is designed so that the bot will enter the market only if both RSI and CCI give the green light. This is a double barrier against market traps.
Different Timeframes (Global Supervision)
The most common cause of liquidations is local blindness. On a 5-minute chart, a coin might look like it has corrected and is ready to grow. The bot enters the trade. But if you zoom out to a 4-hour timeframe (4h), it turns out the asset is at a historical high and has just started to fall.
In Veles, you can configure filters on different timeframes simultaneously:
- Filter #1 (Global): RSI on a higher timeframe (e.g., 1h or 4h). Blocks trading if the global trend is overheated.
- Filter #2 (Local): Oscillator on the working timeframe (e.g., 15m). Looks for the perfect entry point intraday, but only if the global filter has given permission.
Conclusion: Stop Guessing, Start Testing
The market of February 2026 will destroy anyone who blindly sets parameters based on guides or textbooks. What worked perfectly in a bull market six months ago can become the cause of a deep drawdown today.
The philosophy of Veles Finance is mathematical risk control. Your task is to select a coin, analyze its historical behavior (at what indicator values it reverses), and build your combination of RSI and CCI filters.
Be sure to run your setup through the Veles backtest module. If the backtest shows that your combination of filters saved the bot from drawdowns during historical crashes — then you have found your strategy. Launch the algorithm and let math work for you.